October is when the biggest university endowments − those with over $1B − share their annual investment results. From these early reports, we can glean what performance drivers we will see, ahead of the full NACUBO-Commonfund Study of Endowments, which comes out in February 2026.
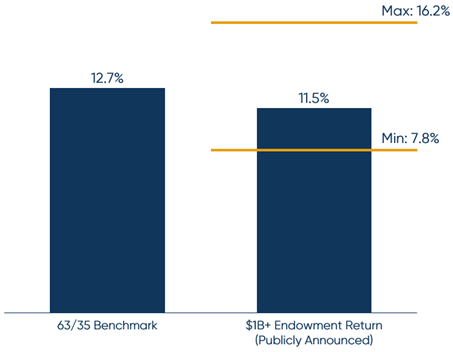
The average return of $1B+ university and college endowments that publicly announce is 11.5% vs. 12.7% for the 65% MSCI ACWI / 35% Bloomberg Agg. This represents the second consecutive year of double-digit gains, following an 11.2% average 1-year performance for all institutions in FY24, per the NACUBO-Commonfund Study of Endowments. However, the trends of what drove performance have shifted in FY25.
FY25 Endowment Returns
What is driving the returns?
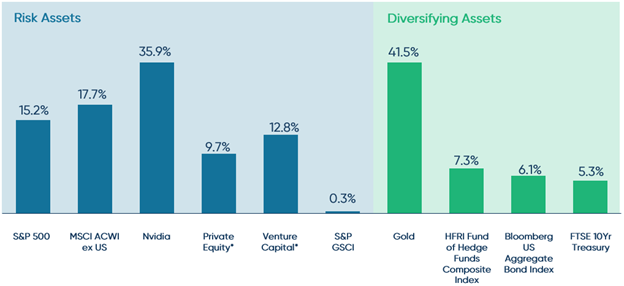
- A return to long-term trends: top-performing endowments have large private equity allocations. Certain sub-asset classes like growth or pre-IPO private equity outperformed. Broadly, the return spread between the allocations appears to be narrowing with private equity and venture posting high single digit/low double digit returns vs. 15.2% for the S&P 500, a spread of only 300-500bp.
- Strong absolute returns in an unusual year where both equities and bonds contributed positive returns. Both risk and diversifying assets performed well, highlighting broad macro and economic concerns despite strong equity returns.
- AI continues to drive equity markets. Portfolios with exposure to AI-related themes like Nvidia outperformed.
- Return of international performance. FY25 made the case for international diversification in equities, with MSCI ACWI ex US (17.7%) outperforming the S&P 500 (15.2%).
- Broad performance in diversifying assets, including gold. Investors looked for and received performance in a swath of uncorrelated asset classes, including gold, hedge funds and traditional fixed income.
Finally, the Endowment Tax is coming. Multiple private universities commented on the forthcoming increase in tax rate in their FY25 annual reports and endowment return press releases. The increase in the Endowment Tax rates goes into effect for taxable years beginning after December 31, 2025. For institutions with a fiscal year end of June 30, this means the new tax rate would apply starting July 1, 2026.
FY25 Asset Class Returns
How did individual endowments do?
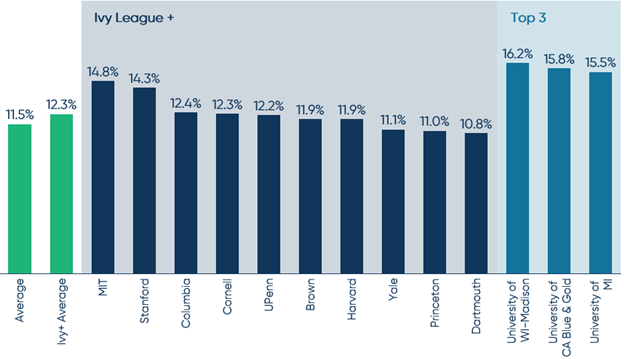
When looking at individual returns, the Ivy League and other renowned private endowments returned slightly above the total group. The top three returns came from public universities, with University of Wisconsin-Madison the highest FY25 performer with 16.2%.
FY25 Returns Publicly Announced
Case study: private allocation of top performers
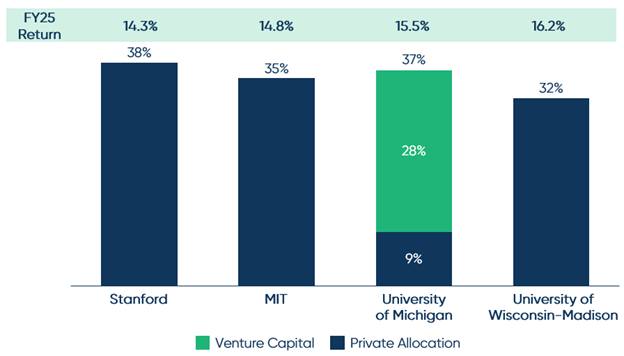
Looking at top performers’ asset allocation, it’s clear that the two-year trend of large private allocations being a detractor has come to a conclusion. Among the top performers that publicly release their asset allocation, each had approximately one-third or greater invested in private equity. A standout example on the strength in late-stage venture/growth is University of Michigan, which returned 15.5%. University of Michigan states that 28% of its portfolio is in venture capital with an additional 9% in private equity.
FY25 Top Returners Private Allocation
The materials are being provided for informational purposes only and constitute neither an offer to sell nor a solicitation of an offer to buy securities. These materials also do not constitute an offer or advertisement of TIFF’s investment advisory services or investment, legal or tax advice. Opinions expressed herein are those of TIFF and are not a recommendation to buy or sell any securities.
These materials may contain forward-looking statements relating to future events. In some cases, you can identify forward-looking statements by terminology such as “may,” “will,” “should,” “expect,” “plan,” “intend,” “anticipate,” “believe,” “estimate,” “predict,” “potential,” or “continue,” the negative of such terms or other comparable terminology. Although TIFF believes the expectations reflected in the forward-looking statements are reasonable, future results cannot be guaranteed.