FY26 Endowment Performance Drivers

Executive Summary

  • Universities and colleges with endowments above $1B that have announced FY26 results returned 19.3% on average, beating the 17.6% return of a 70% MSCI ACWI / 30% Bloomberg Agg benchmark and marking a third straight year of double-digit gains.
  • Returns were unusually far apart, and the best results were the highest since FY21.
  • Venture capital, and SpaceX in particular, drove the top results: The University of North Carolina (UNC) and Washington University in St. Louis (WashU) each returned about 37% and credited roughly half of their gains to SpaceX (plus Cerebras for WashU).
  • Strong public equity markets, a broader AI trade, hedge funds, and commodities added to returns against meager fixed income returns.
  • SpaceX rewarded patient investors, some of whom waited 17 years, but it has left some portfolios with large, volatile positions they cannot yet sell or rebalance.

Overview

In addition to leaf peeping season, the fall is when the biggest university endowments (those with over $1B) share their annual investment results. From these early reports, we can understand what drove performance in FY26 portfolios, ahead of the full NACUBO-Commonfund Study of Endowments, which comes out in February 2027.

The average return of $1B+ university and college endowments that publicly announce was 19.3% vs. 17.6% for the 70% MSCI ACWI / 30% Bloomberg Agg. This represents the third consecutive year of double-digit gains, following a 10.9% and 11.2% average 1-year performance for all institutions in FY25 and FY24, respectively, per the NACUBO-Commonfund Study of Endowments. The 3-year average return stands at 13.7%1, a marked change from FY22’s -8.0%. A smaller number of sub-$1B universities and colleges also publicly announced, with an average return of 14.7%.

FY26 Endowment Returns Overview
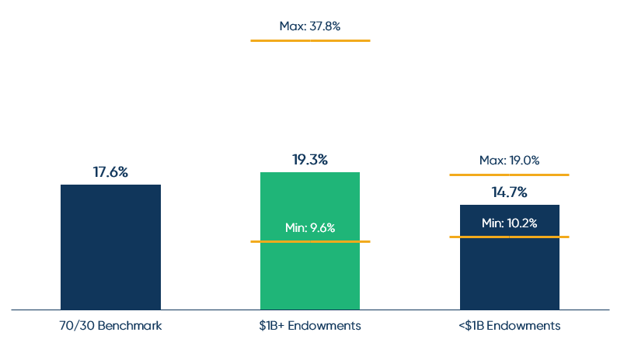
FY26 Endowment Returns Overview
Source: Endowment returns as reported by individual universities or news sources, as of November 6, 2026, as found by TIFF analysis, with special assistance from Caryl Anne Francia, and Owl Labs. Represents 74 $1B+ and 18 sub-$1B university and college endowments. 70% MSCI All Country World Index, 30% Bloomberg US Aggregate Bond Index.

What is remarkable about this year’s returns is the wide dispersion and the highs of the best performers. Typically, we see a tighter range among institutions; this phenomenon will be discussed later and its primary driver (hint, it rhymes with SmaceX). We have not seen highs like this since FY21, when NACUBO 1-year was 30.6% for all institutions. However, we would note there is a strong clustering of returns.

FY26 Endowment Return Dispersion
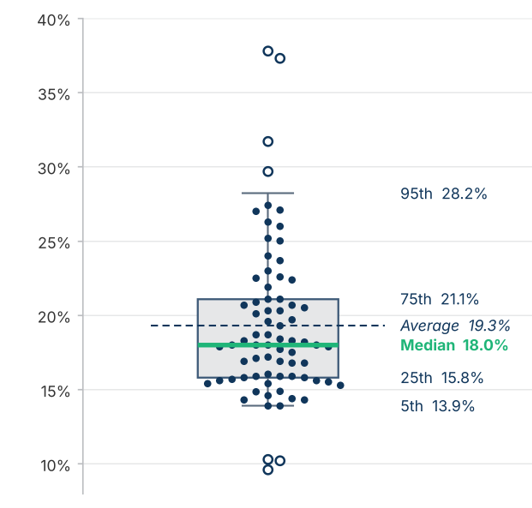
FY26 Endowment Return Dispersion
Each dot is one institution. Box spans the 25th to 75th percentile; whiskers span the 5th to 95th. Open circles fall outside the whiskers. Range 9.6% to 37.8%; standard deviation 5.3%. Source: Endowment returns as reported by individual universities or news sources, as of November 6, 2026, as found by TIFF analysis, with special assistance from Caryl Anne Francia, and Owl Labs. Represents 74 university and college endowments.

What Is Driving the Returns?

  1. Equity-oriented portfolios performed well as equity markets broadly returned double-digit returns, offsetting a meager year for fixed income. In equity markets, there was broad-based market strengthening, allowing many strategies to perform well. There were few bad choices in public equities, only relatively better choices, including emerging markets, biotech, and tech.
  2. Venture, in particular SpaceX, exposure led to top performance. Venture capital, in particular SpaceX, was a key performance driver in FY26. Most of the eye-popping performance numbers 37%+ were at least partially attributed to SpaceX exposure, which has been estimated to have returned 280%.2 Venture capital broadly had a strong year with industry numbers estimating 28.8%.
  3. AI theme continued to drive equity markets. Similar to last year, portfolios with exposure to AI-related themes outperformed, though this year the trade expanded to the entire AI value chain, such as semiconductors.
  4. Hedge funds provided uncorrelated returns to bonds. Hedge funds continued their strong outperformance over bonds. The diversification of strategies performed well in a highly dispersed, volatile equity market and active capital markets.
  5. Commodities delivered in a volatile market. Commodities increased on the back of an oil supply shock due to the conflict in the Middle East paired with increased demand from AI and data centers. This included both energy and metals.

FY26 Asset Class Returns
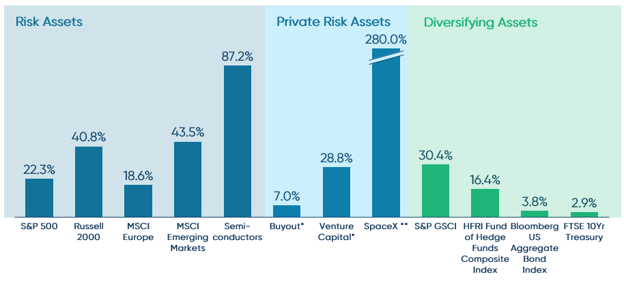
FY26 Asset Class Returns
*As reported by State Street Investment Management. **As estimated by Markov Processes. Source: State Street Investment Management, Markov Processes.

How Did Individual Endowments Do?

The top 10 performers include a wide array of universities, from public and private institutions to those with mid-sized and large endowments. UNC took the top spot with WashU a very close second. Each reported eye-popping returns of 37%+. The Ivy League and other renowned private endowments returned above the total group average (21.9% vs. 19.3%), while private universities outpaced public universities (20.9% vs. 18.2%).

FY26 $1B+ Individual Institutions Publicly Announced Endowment Returns
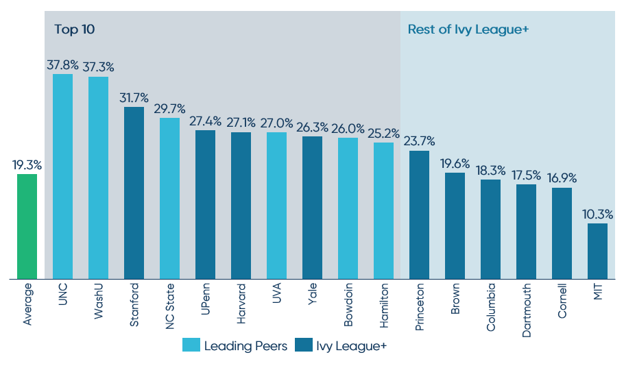
FY26 $1B+ Individual Institutions Publicly Announced Endowment Returns
Source: Endowment returns as reported by individual universities per TIFF analysis.

The SpaceX Factor

SpaceX had unprecedented impact in FY26. In modern history, we have not had a singular company have such an influence on endowment performance and markets. With its $75B initial public offering (IPO) on June 11, SpaceX became the largest IPO in history, roughly 3x the prior record of Saudi Aramco ($25.6B) in 2019.

Both top performers, UNC and WashU, noted SpaceX was responsible for a meaningful portion of their performance. UNC reported about half of its 37.8% growth came from SpaceX alone.3 In other words, without that one investment, UNC would have returned approximately 19%, or the average for the $1B+ cohort. Similarly, WashU stated that SpaceX and Cerebras accounted for about half of its 37.3% growth.4

Three points stood out to us, in addition to the original point on the unusual nature of SpaceX’s level of impact:

  • SpaceX represents the long-term vision for certain illiquid investments: SpaceX represented almost two decades of waiting and required a long-term view on capital. Both UNC and the University of Colorado invested in 2009, with original investments of $2M5 and $150K6. Stefan Strein, President of UNC Management Company, summarized it best: “We have the ability to lock up capital for a very long time, giving us the opportunity to harvest off illiquid investments. SpaceX is a great example of that. We made that initial investment with a venture capital fund in 2009, and 17 years later, we are now harvesting an enormous gain on that investment.”7
  • Investors obtained exposure through both venture capital funds and through direct private purchases: As expected, venture capital funds were important facilitators of investments in SpaceX. Founders Fund was the largest venture capital owner, with its 5%+ combined ownership requiring public disclosure via an SEC 13G filing. Interestingly, direct, private SpaceX purchases pre-IPO were also a source of exposure. Certain investors were presumed to have bought shares pre-IPO, including the University of California (9.8M shares) and Harvard University (12.9M shares) as reported in their June 30, 2026 13Fs.
  • Unintended consequences – illiquid concentration: SpaceX’s success means it may have grown into outsized positions in certain portfolios. Although SpaceX is now publicly traded, these shares are not immediately liquid, either due to IPO lock-ups or ownership via venture capital funds. The result is an unusual problem: an illiquid, concentrated position in a volatile single stock. With no way to rebalance, certain portfolios will be at the mercy of markets and SpaceX stock price. The stock fell 16% from its first trade to October 30 and is down 36% from its June peak. As Scott Wilson, Chief Investment Officer of Washington University Investment Management Company, put it: “It’s a high-class problem, but it is just a problem. We want a diversified portfolio, and having more than 10% of our assets in one stock is not something we want long-term.”8

The materials are being provided for informational purposes only and constitute neither an offer to sell nor a solicitation of an offer to buy securities. These materials also do not constitute an offer or advertisement of TIFF’s investment advisory services or investment, legal or tax advice. Opinions expressed herein are those of TIFF and are not a recommendation to buy or sell any securities.

These materials may contain forward-looking statements relating to future events. In some cases, you can identify forward-looking statements by terminology such as “may,” “will,” “should,” “expect,” “plan,” “intend,” “anticipate,” “believe,” “estimate,” “predict,” “potential,” or “continue,” the negative of such terms or other comparable terminology. Although TIFF believes the expectations reflected in the forward-looking statements are reasonable, future results cannot be guaranteed.

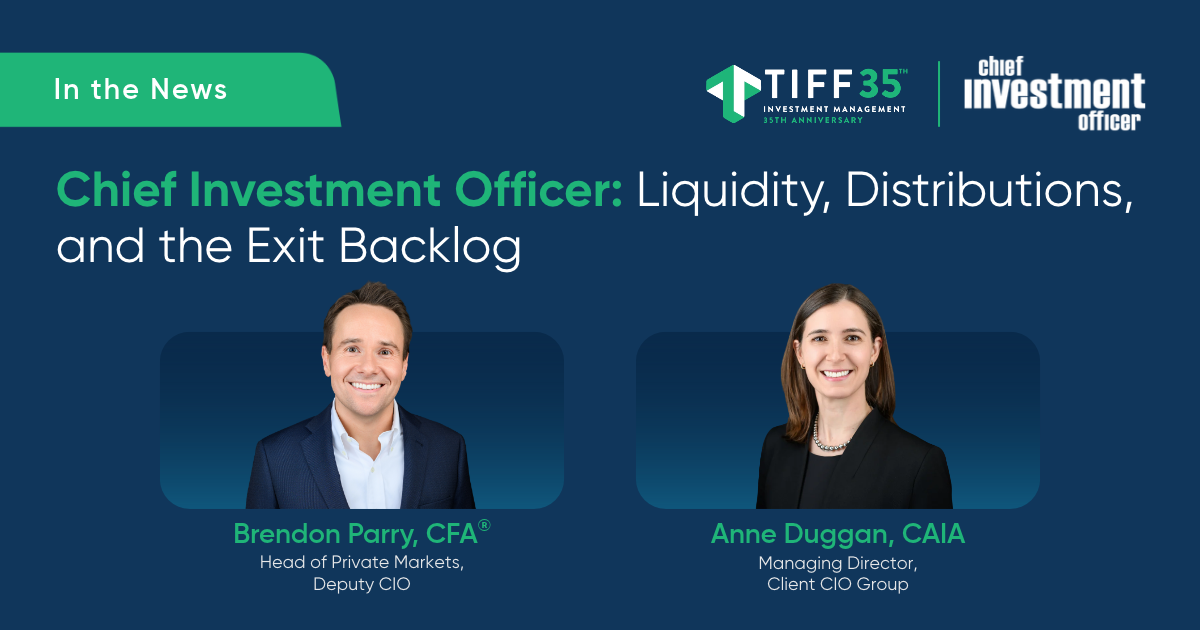
Chief Investment Officer: How Endowments Are Navigating Private Equity Backlogs

A recent article from Chief Investment Officer covered how private equity backlogs and slow exit volumes are impacting liquidity-constrained nonprofits. Anne Duggan, Managing Director, Client CIO Group, shared why endowments are responding to this challenge by modifying manager lineups and asset allocations. TIFF Deputy CIO, Head of Private Markets, Brendon Parry, was also quoted, noting that investors have not shied away from the private equity asset class as a whole; they have, however, become more aware that finding the right manager matters more than ever.

Read the full article here

The materials are being provided for informational purposes only and constitute neither an offer to sell nor a solicitation of an offer to buy securities. These materials also do not constitute an offer or advertisement of TIFF’s investment advisory services or investment, legal or tax advice. Opinions expressed herein are those of TIFF and are not a recommendation to buy or sell any securities.

These materials may contain forward-looking statements relating to future events. In some cases, you can identify forward-looking statements by terminology such as “may,” “will,” “should,” “expect,” “plan,” “intend,” “anticipate,” “believe,” “estimate,” “predict,” “potential,” or “continue,” the negative of such terms or other comparable terminology. Although TIFF believes the expectations reflected in the forward-looking statements are reasonable, future results cannot be guaranteed.

S&P Global: Valuation Gap Remains Core Bottleneck

Brendon Parry, Head of Private Markets, Deputy CIO, was recently quoted in an S&P Global Market Intelligence article on the slowdown in private equity exits. Parry explained that the valuation gap between buyers and sellers remains the core bottleneck, with software companies now facing the question of “disruptor or disrupted?”

Read the full article here

The materials are being provided for informational purposes only and constitute neither an offer to sell nor a solicitation of an offer to buy securities. These materials also do not constitute an offer or advertisement of TIFF’s investment advisory services or investment, legal or tax advice. Opinions expressed herein are those of TIFF and are not a recommendation to buy or sell any securities.

These materials may contain forward-looking statements relating to future events. In some cases, you can identify forward-looking statements by terminology such as “may,” “will,” “should,” “expect,” “plan,” “intend,” “anticipate,” “believe,” “estimate,” “predict,” “potential,” or “continue,” the negative of such terms or other comparable terminology. Although TIFF believes the expectations reflected in the forward-looking statements are reasonable, future results cannot be guaranteed.

Strong 2025 Returns Amid Rising Mission Demands: Takeaways from the Council on Foundations-Commonfund Study

What the Study Reveals About Balancing Spending, Higher Return Objectives, and Long-Term Portfolio Strategy

Foundations posted strong 2025 returns on average, marking a third consecutive year of double-digit gains, even as some faced rising mission demands. The 2025 Council on Foundations-Commonfund Study of Investment of Endowments for Private and Community Foundations reported average net returns of 14.1% for private foundations and 14.7% for community foundations. Longer-term results also remained strong, with ten-year annualized returns of 9.0% and 8.6%, respectively.

Recent results supported portfolio values at a time when some institutions faced increased demands on their resources. At the same time, 32% of private foundations reported increasing spending in response to public-policy conditions, up from 23% in 2024, and 21% reported making special appropriations, up from 14%. Together, these findings suggest that some private foundations adjusted actual spending to respond to changing conditions while average stated policy spend rates held steady.

The Study also offers insight into how foundations translate long-term investment objectives into portfolio strategy while supporting current spending and preserving purchasing power.

Returns Have Supported Long-Term Objectives, But the Hurdle Has Risen

Most foundations reported having a stated long-term return objective. In 2025, 84% of private foundations and 75% of community foundations reported having one, with average objectives of 7.4% and 7.2%, respectively.

Average reported five-, ten-, and fifteen-year annualized returns exceeded the 2025 average stated objective for both foundation types. Twenty-year returns were slightly lower, at 7.2% for private foundations and 7.1% for community foundations. These comparisons provide relevant context, although the objectives in place over those historical periods may have differed from those reported in 2025.

More notable is that reported objectives increased in 2025. Average objectives rose from 6.6% to 7.4% for private foundations and from 6.9% to 7.2% for community foundations. Because participating institutions vary from year to year, these changes may reflect both revisions to individual objectives and differences in the composition of the surveyed group.

The increase in stated objectives raises the return hurdle going forward. Investment committees should assess whether those objectives are consistent with the returns their portfolios can reasonably be expected to generate over a full market cycle while supporting spending, maintaining sufficient liquidity, and preserving purchasing power. For foundations that have raised their objectives, boards and committees should understand why the hurdle changed, determine whether the existing portfolio can support it, and evaluate whether the tradeoffs among return, risk, spending, and liquidity remain appropriate. If the portfolio cannot support the higher hurdle within acceptable risk and liquidity parameters, committees may need to revisit the relationship among the return objective, spending policy, and portfolio structure rather than simply assume more investment risk.

Similar Objectives, Different Portfolios

Private and community foundations reported similar long-term return objectives but pursued them through substantially different portfolios. Private foundations allocated approximately 46% to alternative strategies, compared with 21% for community foundations. Average target allocations to private or illiquid investments were 23% and 10%, respectively. The groups also defined their objectives differently: private foundations were more likely to use an inflation-based target, while community foundations were more likely to use a nominal return target.

Portfolio construction depends on more than the return objective. Private foundations generally fund required annual distributions from an established asset base and often rely less on recurring contributions. Community foundations may receive ongoing gifts while administering charitable funds with varied spending patterns, restrictions, and liquidity needs.

Peer allocations can inform an investment committee’s assessment, but they should not determine the foundation’s portfolio strategy. The return objective describes what the portfolio needs to accomplish, but the portfolio must reflect the foundation’s risk tolerance, time horizon, governance structure, and investment resources. Asset allocation is a strategic framework that should be reviewed and, when appropriate, revised as a foundation’s objectives, spending needs, liquidity requirements, or capacity for risk change.

Strong Returns Create an Opportunity to Reassess

Three consecutive years of double-digit gains have strengthened the financial position of many foundations, but they do not eliminate the need to test whether the investment program remains aligned with the institution’s long-term requirements. As reported return objectives rise and some foundations face greater mission demands, committees should assess whether the portfolio can support spending, maintain sufficient liquidity, withstand market stress, and preserve purchasing power over a full market cycle.

Peer results provide important context, but they are not a blueprint. The appropriate strategy depends on each foundation’s obligations, cash flows, risk capacity, and governance resources. Strong recent returns give investment committees and boards an opportunity to reassess that alignment from a position of strength, while decisions can be made deliberately rather than under pressure.


Source: 2025 Council on Foundations-Commonfund Study of Investment of Endowments for Private and Community Foundations, published in 2026. Returns are net of fees, self-reported by participants, and shown as simple averages across the 171 private foundations and 114 community foundations that participated in the Study. One-year returns are for calendar year 2025; multi-year returns are annualized for periods ending December 31, 2025, and reflect participants reporting each period. Actual asset allocation figures are dollar-weighted. Participating institutions vary from year to year. These figures reflect the experience of Study participants and do not represent the performance of TIFF or any TIFF client or fund. Past performance is no guarantee of future results.

Unless otherwise noted, all returns, return objectives, asset allocations, and spending figures in this paper are from the 2025 Council on Foundations-Commonfund Study of Investment of Endowments for Private and Community Foundations.

The materials are being provided for informational purposes only and constitute neither an offer to sell nor a solicitation of an offer to buy securities. These materials also do not constitute an offer or advertisement of TIFF’s investment advisory services or investment, legal or tax advice. Opinions expressed herein are those of TIFF and are not a recommendation to buy or sell any securities.

These materials may contain forward-looking statements relating to future events. In some cases, you can identify forward-looking statements by terminology such as “may,” “will,” “should,” “expect,” “plan,” “intend,” “anticipate,” “believe,” “estimate,” “predict,” “potential,” or “continue,” the negative of such terms or other comparable terminology. Although TIFF believes the expectations reflected in the forward-looking statements are reasonable, future results cannot be guaranteed.

TIFF Private Markets Director Tom Duffy on the VC10x Podcast

Tom Duffy, Director, Private Markets, at TIFF Investment Management, joined the VC 10x Podcast with Prashant Choubey to discuss TIFF’s philosophy for venture capital investing and how the firm evaluates and partners with fund managers across market cycles.

Key takeaways from the conversation:

  • Manager Selection: TIFF looks for a distinct edge, whether access, thesis, or a manager’s ability to earn allocations in competitive rounds, often backing managers before they are widely recognized.
  • Small Markets, Bigger Edge: TIFF targets less efficient corners of the market, where relationships and network access, not scale, drive outcomes.
  • Backing Emerging Managers: Fund I managers require a different evaluation lens than established managers. Team dynamics, sourcing strategy, and a founder’s ability to build conviction with limited track record all factor heavily into TIFF’s diligence.
  • Judgment Can’t Be Automated: As data and capital become commoditized through AI, human judgment still drives standout returns. Technology speeds up the process, but it can’t replace the discernment.

Listen on Apple ->

Watch on YouTube ->

Disclaimer: Tom Duffy, CFA, CFP, is a Director, Private Markets at TIFF Investment Management. All views expressed by him on this podcast are solely his opinions and do not reflect the opinions of TIFF. You should not treat any opinions expressed by Tom as a specific endorsement to make a particular investment. References to any securities are for informational purposes only and do not constitute an investment recommendation or offer to provide investment advisory services. Any past performance discussed is not indicative of future results. Please keep in mind that investment in a fund entails a high degree of risk, including the risk of loss. Please note that the ads featured in this podcast are not endorsed by TIFF, and TIFF is not a sponsor of these ads.

The materials are being provided for informational purposes only and constitute neither an offer to sell nor a solicitation of an offer to buy securities. These materials also do not constitute an offer or advertisement of TIFF’s investment advisory services or investment, legal or tax advice. Opinions expressed herein are those of TIFF and are not a recommendation to buy or sell any securities.

These materials may contain forward-looking statements relating to future events. In some cases, you can identify forward-looking statements by terminology such as “may,” “will,” “should,” “expect,” “plan,” “intend,” “anticipate,” “believe,” “estimate,” “predict,” “potential,” or “continue,” the negative of such terms or other comparable terminology. Although TIFF believes the expectations reflected in the forward-looking statements are reasonable, future results cannot be guaranteed.