3rd Quarter 2026 CIO Commentary

Market Observations

Market Summary

  • Q3 2026 was a quarter with significant cross currents in capital markets. The MSCI ACWI Index was up 1.6% overall with technology being by far the largest contributor (6% return). In fact, all of the ACWI return can be explained by just Microsoft (+38%) and NVIDIA (+16%).
  • Energy also had an excellent quarter with the sector up over 15%. Renewed conflict in the Persian Gulf contributed to a 30% increase in the price of oil in the quarter.
  • Outside of tech and energy, the rest of the market as a group produced a slightly negative return. Healthcare and financials did well but many interest rate sensitive equity areas like small cap, real estate and utilities produced negative returns.
  • For hedge funds, preliminary data from HFRI for the Fund of Funds Composite shows an estimated 1.7% loss the quarter.
  • The most notable macro development was in the bond market. The ten-year U.S. Treasury yield increased by over 80 basis points to close at 5.29%, the highest level in roughly 20 years.
  • Inflation continues to exceed the Fed’s long-term targets, resulting in an increase to the Fed Funds target rate of 25 bps, the first hike in three years.

Rising Treasury Yields – Risks and Opportunities

The yield to maturity on the 10-year U.S. Treasury bond is arguably the most important reference rate in global capital markets. We believe there are a variety of factors that have put pressure on U.S. Treasury bonds this year. The charts below highlight some of these issues.

1. Debt to GDP

Total U.S. government debt outstanding is now roughly 100% of GDP, an all-time high except for a brief period at the end of World War II. However, the explicit debt outstanding likely understates the magnitude of the actual liability. If we include a basic estimate of additional liabilities including employee and veteran benefits, Social Security and Medicare the overall ratio of government liabilities to GDP is 442%.
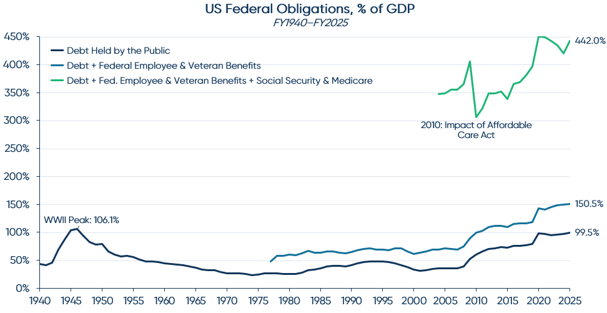
US Federal Obligations, % of GDP
Source: TIFF analysis. OMB Historical Tables (FY2027 Budget), Tables 7.1 and 10.1; U.S. Treasury, Consolidated Financial Statements (1977–1996) and Financial Report of the U.S. Government (1997–2025). Debt held by the public and fiscal year GDP per OMB. Employee and veteran benefits payable per Treasury balance sheet; pre-1997 figures are unaudited and not fully comparable. Social insurance is the 75-year open-group present value (2004–25) and is not a balance-sheet liability.

2. Net Interest Expense as a Percentage of GDP

Total government interest expense as a percentage of GDP is now over 3%, close to the all-time high level from 1991. In addition, the Congressional Budget Office projects that this figure will increase to above 4% over the next decade due to a combination of refinancing maturing debt at higher interest rates, future deficit spending and growing entitlement programs. The reason that the interest expense as a percentage of GDP is so much higher than in the 1940s is because the weighted average rate on the debt outstanding is materially higher (less than 2% in 1945 compared to 3.4% and climbing today).
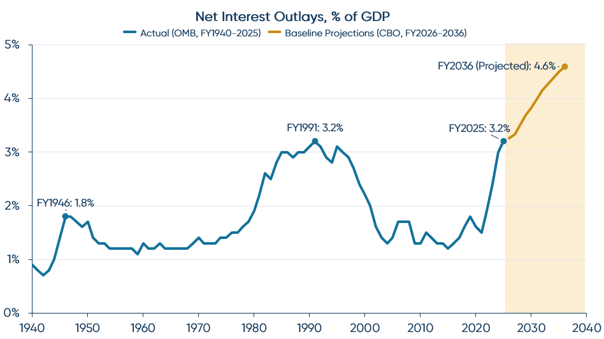
Net Interest Outlays, % of GDP
Source: TIFF analysis. OMB Historical Tables, Budget of the U.S. Government, Table 3.1; CBO, The Budget and Economic Outlook: 2026 to 2036 (Published Feb. 2026), Table 1-1. FY2026–FY2036 are projections.

3. Net Interest Expense / Defense Spending

High interest expenses can crowd out more productive uses of capital including national security, economic growth, public health and other strategically important initiatives. For the first time in U.S. history, the country is now spending more on interest expense than on the military.
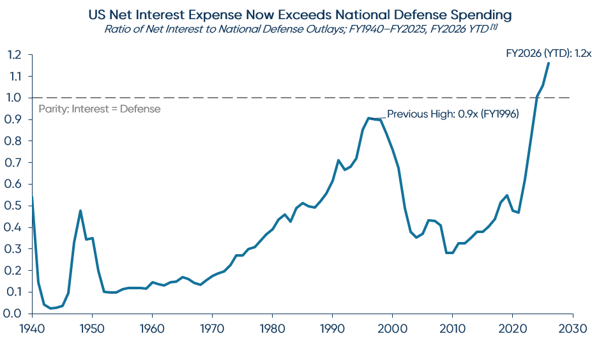
US Net Interest Expense Now Exceeds National Defense Spending
Source: TIFF analysis. OMB Historical Tables, Budget of the U.S. Government, Table 3.1; U.S. Treasury, Monthly Treasury Statement, Table 9. Notes: [1] FY2026 YTD represent published figures from October 2025-August 2026 and will differ from full FY2026 figures once published. U.S. fiscal year runs from October-September each year.
The above set of financial conditions could be improved through adjustments to legislation and balancing the national budget. However, cutting benefit programs or raising taxes tends to be difficult, especially in a highly divisive political environment. In addition, U.S. inflation continues to be at levels higher than the Fed’s long-term targets (implying that the Fed Funds rate is more likely to go up than down). Increased defense spending and adjustments to trade policy could also put upward pressure on costs which have a flow-through impact on inflation and interest rates.

Some readers may argue that many of the above metrics have been challenging for years. Why the move in rates now? That is a difficult question to answer. Technology stocks were at very high valuations for years before the spring of 2000. Major Wall Street investment banks had highly levered balance sheets for years prior to fall of 2008. Identifying the spark that ignites a change in sentiment regarding longstanding risks is hard to do. The U.S. government has gotten away with an unsustainable fiscal imbalance for a long time. Something that can’t go on forever eventually doesn’t. Whether this recent uptick in rates is just noise or the start of a longer-term trend remains to be seen.

In the interest of providing a balanced assessment, there are other reasons why Treasurys have likely been under pressure. Large debt issuance by technology companies to fund the buildout of data centers and other AI infrastructure is also having an impact on rates, particularly in the 5-to-10-year maturity band of the curve. For context, through the last twelve months ending June 30, 2026, just four companies – Alphabet, Amazon, Meta and Oracle – issued close to $300 billion in bonds1. These are businesses that for many years issued very little debt. Between 2020 and 2022, the last years of the pre-AI era, total non-financial U.S. corporate bond issuance averaged less than $1 trillion. While a function of a large move in a short time, current yields are not high relative to long-term history. The best path forward for the U.S. is some combination of continued strong GDP growth and more fiscal discipline, both of which are still possible, but the degrees of freedom and flexibility on timing are starting to tighten.

For our portfolios, the fiscal pressures warrant caution, but higher yields also improve the prospective return from holding Treasurys. Based on an evaluation of the various observations above, we made an adjustment to the bond portfolios outlined in detail in the next section.

Performance, Positioning and Research Priorities

Performance

We expect the liquid portions of our portfolios to exceed the 65/35 benchmark for Q3 by over 1%. Exact totals will vary by client portfolio. In Public Equities, we expect to end up slightly ahead of ACWI. Another strong quarter by our systematic managers was offset by mixed results from some of our fundamental concentrated managers. Diversifiers (mostly hedge funds) had a very good quarter relative to benchmark. The preliminary results for our portfolios are an absolute return of over 1% (with a few accounts coming in lower), over 3% ahead of the HFRI Fund of Funds benchmark. Given the unusually strong performance from funds of hedge funds in the first half of the year, we think there was some reaching for extra return in the asset class. We have not done that, instead choosing to target a consistent risk posture with an expected beta to equities of approximately 0.30, low volatility and a broadly diversified portfolio across complementary sub-strategies. Areas of strong results in Q3 for our Diversifiers portfolio included systematic strategies, merger arbitrage and event-driven equities. Our Fixed Income portfolios generated absolute losses but also generally outperformed their benchmark due to our lower duration in a rising rate environment. We entered the quarter with a weighted average duration of 4.25 years compared to 5.95 years for the Bloomberg Aggregate Index. At this point we have received the private equity marks for Q2. Our private equity portfolios generated a gain of over 4%, a decent absolute result but well behind the MSCI ACWI return of 15% for the comparable quarter. While private investments have underperformed public equities over the past few years, we continue to believe in the long-term prospects for the asset class. Particularly in the two strategies that we manage in-house as opposed to with outside managers – direct transactions with independent sponsors and secondaries – we are continuing to source attractive opportunities.

Positioning

We continue to be close to benchmark across geography and sector exposures within Public Equities. During the quarter, we completed a review of AI-related exposure, which spans multiple industries and may not be fully captured by traditional risk models. Using AI-assisted analysis of public company information, followed by investment team review and comparison with external research, we identified businesses with meaningful AI sensitivity. Overall, we were underweight AI-related businesses broadly, consistent with our underweight semiconductor exposure that detracted from Q2 performance. We used July’s market weakness to selectively increase AI-related exposure through adjustments to passive holdings. These changes shifted the composition of our expected tracking error toward idiosyncratic security selection and away from general factor risk.

In addition, we made an adjustment to our bond portfolios at the end of September. Our bond benchmark is the Bloomberg Aggregate Index. However, our preference is to run conservatively in this area and assume corporate cash flow risk elsewhere in the portfolio, particularly in equities, where we think we will be better compensated over time (i.e., unlimited upside, unlike with investment grade bonds). That is why our portfolios have been almost 100% U.S. Treasury bonds and bills for most of the past decade. In addition, we have had lower duration than the benchmark for years, particularly during the COVID period when we gauged that bonds offered zero real return and diminished diversification value. We have increased duration over the past few years, but have remained underweight the benchmark for a variety of reasons including those noted above. Having lower duration has served us well over 2026 as rates have risen. However, by the end of the quarter Treasury yields had reached 20-year highs and long-term inflation expectations, at least as measured by TIPS breakevens, have remained modest at roughly 2.0.-2.5%, depending on forecast horizon. While there is always a risk that actual inflation will be higher than expected inflation, an implied real return between 2.5% and 3.0% represents some of the best value we have seen in Treasurys in decades. We increased our duration to 5.0 years over last few trading days in September. Similar to the AI adjustment in equities, we are still assuming less duration risk than the benchmark, but it made sense to reduce the size of the bet given the price moves in Q3.

We concluded several manager research initiatives this quarter, adding managers to portfolios where appropriate. In Public Equities, additions included Japanese activist strategies focused on improving corporate capital allocation, a multi-manager platform combining fundamental research with systematic risk management, and two emerging fundamental managers. We funded these investments with redemptions from several other active manager positions. We secured favorable fee terms for clients on several of the additions. Within Diversifiers, we gained access to a capacity-constrained systematic manager we have followed for years. We suspect that the limited distributions from private equity portfolios over the past few years is continuing to cause other investors to be forced to make redemptions from their more liquid positions, creating opportunities for us. Together, these additions reflect our ongoing work to continuously improve the portfolios.

Research Priorities

We have multiple promising manager ideas in process, but they do not fall neatly into a single theme and many are earlier stage than some of the ideas we outlined last quarter. We are in various stages of diligence on a multi-manager platform we have followed for years where a change to their terms has made the investment more attractive to us, several public equity managers in Europe and some systematic and arbitrage managers in Asia, a market that continues to have an attractive combination of good liquidity, high volatility and wide dispersion of returns across stocks – a generally supportive set of conditions for active management.

General Updates

In September, TIFF’s Private Markets team hosted its second annual Capital Connections event, bringing together roughly 100 independent sponsors, institutional investors and our board. The program opened with a closed-door information session for sponsors regarding LP priorities when evaluating a first-time fund, followed by a reception and dinner. The event has already generated follow-up deal flow, strengthening TIFF’s relationships across the independent sponsor community. Events like this are critical to our sourcing of leading independent sponsors and deepening our connection to the private equity ecosystem.

We look forward to seeing many of you in Boston on October 28th and 29th at the 2026 TIFF Investment Forum. Thank you for your ongoing partnership and best wishes for a great close to 2026.


Past performance is no guarantee of future results and the opinions presented cannot be viewed as an indicator of future performance. There is no guarantee that any particular asset allocation or mix of strategies will meet your investment objectives.

These materials are being provided for informational purposes only and constitute neither an offer to sell nor a solicitation of an offer to buy securities. These materials also do not constitute an offer or advertisement of TIFF’s investment advisory services or investment, legal or tax advice. Opinions expressed herein are those of TIFF and are not a recommendation to buy or sell any securities.

These materials may contain forward-looking statements relating to future events. In some cases, you can identify forward-looking statements by terminology such as “may,” “will,” “should,” “expect,” “plan,” “intend,” “anticipate,” “believe,” “estimate,” “predict,” “potential,” or “continue,” the negative of such terms or other comparable terminology. Although TIFF believes the expectations reflected in the forward-looking statements are reasonable, future results cannot be guaranteed.

HFRI Fund of Funds Composite Index is an equal weighted index reporting returns (net of all fees) of participating hedge funds of funds. A fund of funds may allocate its assets to numerous managers within a single strategy, or to numerous managers in multiple strategies. HFRI indices are being used under license from Hedge Fund Research, Inc., which does not approve of or endorse the contents of this report.

Footnotes

  1. Includes a $27.3 billion bond issued in October 2025 by Beignet Investor LLC, a Blue Owl Capital-controlled vehicle financing Meta’s Hyperion data center in Louisiana.
2nd Quarter 2026 CIO Commentary

Market Observations

Market Summary

  • Q2 2026 was a strong quarter for equities, with ACWI rallying 14.9% after a 3.2% decline in Q1 due to concerns about the US-Iran conflict.
  • A combination of a ceasefire in Iran, sustained AI-related earnings momentum, and overall optimism about AI capex spend were key positive drivers.
  • Early data indicates a solid quarter for hedge funds, particularly longer-biased equity long/short funds, many of which likely benefitted from AI-related exposure and possibly private company exposure to SpaceX.
  • It was a weaker quarter for bonds as yields backed up slightly, perhaps due to a combination of reallocations to riskier investments after the Iran ceasefire, persistent inflation, and renewed uncertainty about the path of interest rates over the second half of the year.
  • Beyond these headline results, there are several areas we are monitoring that could create a combination of both risks and opportunities over the remainder of the year.

Concentrated Leadership

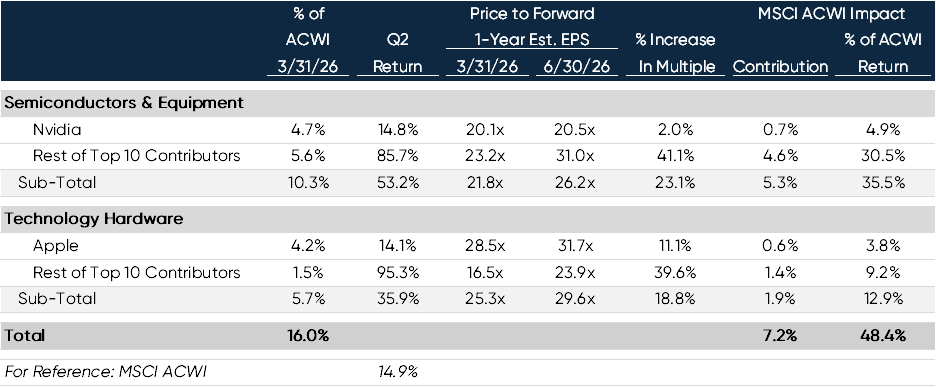
While it was a great quarter for stocks overall, a small number of businesses related to AI hardware capex, specifically semiconductors and memory companies, carried the market. The table below summarizes performance, valuation, and return contribution statistics for just the top ten contributors within the semiconductor and tech hardware industry groups. Bottom line: just 20 stocks in two verticals within tech were responsible for half of the overall index return. Except for Apple and Nvidia, these stocks were up close to 100% on a capital-weighted average basis on the quarter (five of these stocks were up over 200%). As leadership has narrowed, marginal investor demand has become levered. Several asset managers have launched ETFs that hold just one of these stocks on a levered basis. One of these ETFs has grown by over $15 billion in the last six months.

Metrics For Top 10 Contributors in Two Tech Subsectors1

Metrics For Top 10 Contributors in Two Tech Subsectors

Other parts of the AI value chain have not rallied to the same extent. If the appreciation of the high performers proves to be justified by the fundamentals, we would expect these other areas to do well and the market leadership to broaden. However, if the sentiment about AI reverses or fundamentals stall, the top performers from Q2 may have a long way to fall. Some of the recent buyers are levered players, and current valuations are demanding, particularly for the more cyclical companies.

Heavy Forward IPO Calendar

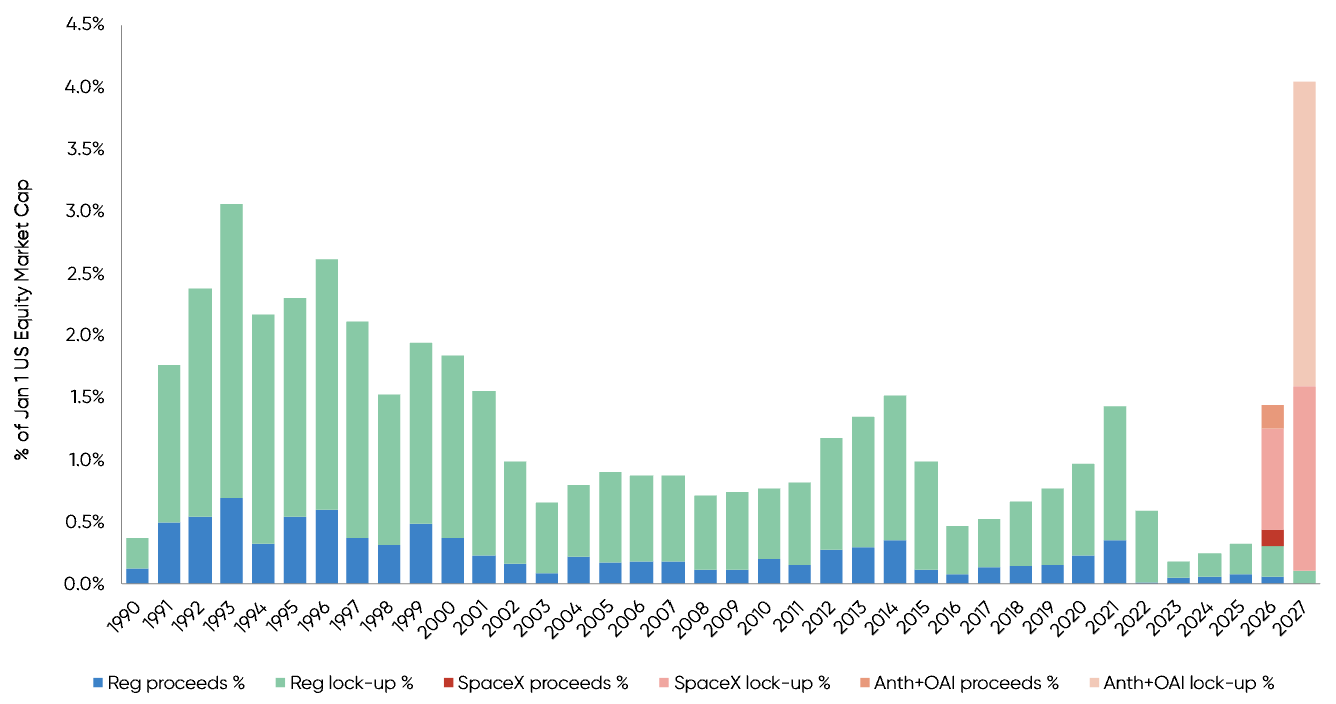
The second market dynamic we are monitoring is the potential impact of several very large IPOs. SpaceX completed its $86 billion offering (including greenshoe) on June 12 and currently trades at a total valuation of over $2 trillion. In addition, the market expects Anthropic and Open AI to complete IPOs over the next few months. The exact sizes of the offerings and company valuations are unclear, but both are expected to raise at least $60 billion dollars and trade at greater than $1 trillion valuations. IPOs of this size are unprecedented. These three mega IPOs are also unusual because the percentage of the total shares sold at the IPO are well below average. Most IPOs are sales of roughly 20% of the total shares. SpaceX sold only 5%.

Shares not sold in an IPO are typically restricted from trading for six months after the offering, meaning that for these three mega IPOs, in addition to the very large amount of dollars raised on the IPO dates, there is also an unusually large backlog of subsequent shares that will come off lock-up between six and twelve months later. The chart below summarizes this dynamic.

US IPO Proceeds & Insider Lock-Up Releases as % of Jan 1 Market Cap (1990-2027)2

US IPO Proceeds & Insider Lock-Up Releases as % of Jan 1 Market Cap (1990–2027)

The blue bars represent actual IPO proceeds from the past few decades. The green bars represent shares released from lock-up following those prior IPOs. The red and orange bars represent shares coming to market associated with the “big three” mega IPOs of 2026. Importantly, this analysis likely understates the aggregate value of the supply coming to market for two reasons:

  1. It ignores potential 2026 and 2027 IPO volume from other companies (difficult to predict, though we know that other private companies are considering IPOs).
  2. It assumes that the shares coming off lock-up are valued at the original IPO price.

If the offerings are successful, the actual value of the shares following the lock-up period may be significantly higher. IPO activity over the past few years has been well below average. However, there will need to be significant demand from public investors for the “big three” new offerings over the next year for them to trade well. Absent a big cash infusion in the form of dividends or share buybacks, raising enough cash to buy shares of the “big three” may put downward pressure on other parts of the equity markets.

Long-term Impact of US-Iran Conflict

We are giving a lot of thought to the long-term impact of the US-Iran conflict on oil prices and the energy markets. As for oil prices, they are likely to stay below $100 / barrel over the short term if traffic out of the Strait of Hormuz can return to normal. Longer term, there is a possibility that oil prices will continue to decline or at least be much less impacted by geopolitical conditions in the Persian Gulf. We see parallels to the onset of COVID, when a shock to the system caused multiple market participants to re-evaluate and ultimately restructure their supply chains. Recent events may cause both suppliers and consumers of oil to reassess their supply chains. Exporting nations in the Gulf are likely to explore alternative distribution routes via pipelines that enable them to bypass the Strait entirely for a greater percentage of their total volumes. Increasing pipeline capacity will be costly and time-consuming but may be worthwhile. Similarly, importing countries, particularly in East Asia, are likely to accelerate their efforts to electrify their transportation networks and other infrastructure to reduce their dependency upon a single region for a critical input. These adjustments would be supportive for a combination of electric vehicles, batteries, certain metals, power infrastructure, and construction-related businesses. We also have seen somewhat greater support of exports by formerly sanctioned countries such as Russia, Iran, and Venezuela.

A Co-CIO Conversation: Risks We Are Watching

As we continue working together in TIFF’s Co-CIO structure, we have been focused on which risks are most likely to matter for portfolios in the second half of the year.

Markets have performed well, supported by solid GDP growth, positive employment trends, and easing inflation pressure as oil prices normalize following the Iran conflict. This provides a constructive backdrop for risk assets. At the same time, the questions ahead are becoming more complex: Will the AI buildout put upward pressure on inflation before productivity benefits emerge? Will equity leadership broaden beyond a narrow group of large-cap technology and AI-related companies? Will the expected IPO calendar affect the supply/demand balance for capital in public markets? Will the results of the mid-term elections be well received by the markets?

These are important questions, but they are questions that can be analyzed through fundamentals, valuations, positioning, and market structure. The harder question to answer is how shifts in policy, regulation, fiscal priorities, or geopolitical posture could affect markets. That risk does not lend itself as easily to scenario analysis, but it has meaningful potential to affect the market’s current trajectory. Against that backdrop, we are also watching whether consumer spending and employment remain resilient, whether the path of interest rates continues to pressure valuations, and whether stress in parts of the credit markets remains contained. These considerations are central to how we are thinking about portfolio construction in the second half of 2026.

— Trevor Graham and Jay Willoughby, Co-Chief Investment Officers

Performance, Positioning and Research Priorities

Performance

We expect the liquid portions of our portfolios to range between 1% ahead (most accounts) and 1% behind the public market equivalent benchmark (e.g., 65/35) for Q2. In Public Equities, we will likely end up trailing the benchmark. The largest detractor from performance was from security selection within technology. Our managers have been slightly overweight software and slightly underweight semiconductors and hardware. Given the sharp moves in the latter categories, these small deviations from the benchmark are creating much more noise than they would in a normal environment. The drag from suboptimal tech positioning within our fundamental managers has been offset by outstanding event-driven results in biotech and solid excess return from our multi-manager platforms. Within Diversifiers, our results will likely be well ahead of the Bloomberg Aggregate Index but behind the HFRI FOF Index. We note a somewhat anomalous result in the HFRI Fund of Funds Index. This index usually performs with a beta to equities of about 0.3. The quarter-to-date results that we have as of this publication show HFRI as capturing closer to 55% of the equity market’s return. The result could be due to unusually high alpha (maybe some pre-IPO investments in SpaceX?) or perhaps it is due to net long exposure drifting upwards. Either way, we have decided to maintain the roughly 0.3 equity beta posture of our own portfolio due to the role we want Diversifiers to play, particularly in tougher environments. Positive contributors to results included our systematic strategies, recoveries in our carbon credit positions, and equity long/short managers focused on technology, Europe, and Taiwan.

Most importantly, our overall long-term results continue to be ahead of benchmarks in most time periods.

Positioning

We have not made material adjustments to our basic exposures within Public Equities or Diversifiers. Within Public Equities, we continue to be near the benchmark across geography and sector exposures. However, we have introduced a risk-management tool to reduce factor risk. We have managed geography and sector risk internally with a combination of simple, readily available ETFs, and futures for decades. Managing style factors is not as easy. After a lengthy, multi-year research and testing period, we have added a market-neutral basket of single stocks designed to neutralize more complex unwanted style factor risk. We have been rebalancing this basket monthly as we receive updated holdings from our managers. This adjustment is designed to reduce the portion of our equity tracking error that comes from unintended factor exposures, such as momentum or volatility, and increase the portion that comes from idiosyncratic security selection. This adjustment should result in more consistent excess returns over time.

In early Q2, we added Topwater to portfolios where we believed the strategy fit the portfolio’s objectives. Topwater is a capacity-constrained multi-manager platform with outstanding risk management. We have tracked this manager for years and finally got a chance to invest when a large LP redeemed.

Forward Research Calendar

The team is working on several projects that we expect to reach a conclusion over the second half of the year. We have been researching activist strategies in Japan for the past several years and we expect to add multiple managers in this area over the next quarter. In addition, we are in the late stages of diligence on a new multi-manager platform that we believe may have a competitive advantage in data. In Diversifiers, we are likely to shift some capital to systematic strategies in anticipation of a higher volatility equity environment. These managers tend to have higher turnover than the fundamental managers and adjust their portfolios more quickly.

Beyond manager research, we are working on a project to better evaluate our overall exposure to AI-related businesses. As one of the major growth drivers in the economy, there are now material elements of AI-related exposures across power, energy, utilities, industrials, and business services. Total exposure is a nuanced issue that is not easily quantified with traditional GICS categories. Depending on our findings, we may make some exposure adjustments over Q3.

Recent Firm Highlights

We recently held the final close for our latest private markets direct fund, a strategy that invests in private businesses alongside independent sponsors rather than allocating to private equity funds. The fund was oversubscribed and closed at its hard cap of $300 million. We are currently in the market with our next series of private equity and venture capital fund of funds.

In June, Andrew Murray and Stephen Grau joined TIFF to lead our efforts in private equity secondaries. TIFF has been an active participant in this market for years as both a buyer and a seller, and we believe the combination of limited distributions over the past three years and continued growth in the private equity market has created an attractive investment opportunity. Given that backdrop, we believe our portfolios will benefit from dedicated resources in this area. Read the full press release, here.

We look forward to seeing many of you in Boston on October 28th and 29th at the 2026 TIFF Investment Forum. Thank you for your ongoing partnership and best wishes for a great summer.

These materials are being provided for informational purposes only and constitute neither an offer to sell nor a solicitation of an offer to buy securities. These materials also do not constitute an offer or advertisement of TIFF’s investment advisory services or investment, legal or tax advice. Opinions expressed herein are those of TIFF and are not a recommendation to buy or sell any securities.

These materials may contain forward-looking statements relating to future events. In some cases, you can identify forward-looking statements by terminology such as “may,” “will,” “should,” “expect,” “plan,” “intend,” “anticipate,” “believe,” “estimate,” “predict,” “potential,” or “continue,” the negative of such terms or other comparable terminology. Although TIFF believes the expectations reflected in the forward-looking statements are reasonable, future results cannot be guaranteed. 

Footnotes

  1. FactSet.

  2. TIFF analysis. IPO proceeds — Jay R. Ritter / Univ. of Florida (1990–2014); EY / Renaissance Capital (2015–2026 YTD). Market cap — World Bank / Siblis Research. SpaceX actuals & lock-up — SEC S-1/A, Renaissance Capital 2Q 2026 Review, CNBC, Motley Fool, Investing.com (June 2026). Anthropic/OpenAI — company announcements, Fortune, CNBC, US News (June 2026). 2027 pipeline — Renaissance Capital IPO Outlook. The 2026 SpaceX lock-up calculation includes the conditional release share block.

4th Quarter 2025 CIO Commentary

Executive Summary

  • 2026 is “game time.” The year ahead should help answer whether the One Big Beautiful Bill (OBBB) supports growth and disinflation, whether deficits can be reined in, and whether the AI boom is durable—or a bubble.
  • OBBB could be a net positive for growth and possibly inflation. We expect tax cuts and investment incentives to support jobs and productivity, potentially keeping inflation contained and giving the Fed room to ease.
  • The budget deficit remains the biggest long-rate risk. With U.S. debt cited at approximately $38.4T by year-end 2025 and still rising, we remain cautious on long duration and mindful of dollar risk.
  • Tariffs may change form, but the peak shock has likely passed. Even if current tariffs are overturned and later re-implemented under different authorities, we expect the worst of the tariff impulse is behind us.
  • AI remains in the middle innings, but scrutiny is rising. Hyperscalers’ 2026 capex is cited at approximately $550–$600B and potentially much more in aggregate, meaning markets will increasingly demand proof of broad adoption and real returns.
  • Outlook and positioning remain constructive, with more volatility. We expect a more two-sided equity market with bigger swings and mid-single-digit gains as a base case, while staying fully invested and close to policy targets. We are modestly overweight healthcare, roughly market weight “Mag 7,” short fixed-income duration, with a slight underweight to the U.S. dollar.

Game Time

Happy New Year! At least that is our hope as we turn the calendar to 2026. While we are optimistic, we are not certain that capital markets will maintain the same excellent streak they’ve enjoyed since 2022. The year ahead may be when we find out if the administrations’ One Big Beautiful Bill (OBBB) actually helps the economy and brings down inflation (we still believe it can), whether U.S. budget deficits can be reined in relative to GDP growth (we doubt it), and finally whether markets are in an AI bubble or if AI can justify all the “pre-game” hype (we are cautiously optimistic).

Because the OBBB cuts taxes for both households and businesses and provides more generous investment incentives, we remain optimistic about prospects for the U.S. economy. Arthur Laffer once asked, “If I tax you 100%, would you work more? If I eliminated your taxes and let you keep everything you make, would you work more?” Everyone in the room agreed that this was not a realistic choice, but that if it was, they would work more if they got to keep more.

We are hopeful that people still feel this way and that the economy will have more people working and more investment supporting these additional jobs. In particular, it would be nice if by exempting taxes on tips and certain overtime, combined with certain child- and work-related credits, the OBBB could help reduce pay inequality. Naysayers don’t bother us; in today’s world, it seems no program can please all of the people. We remain optimistic about the OBBB.

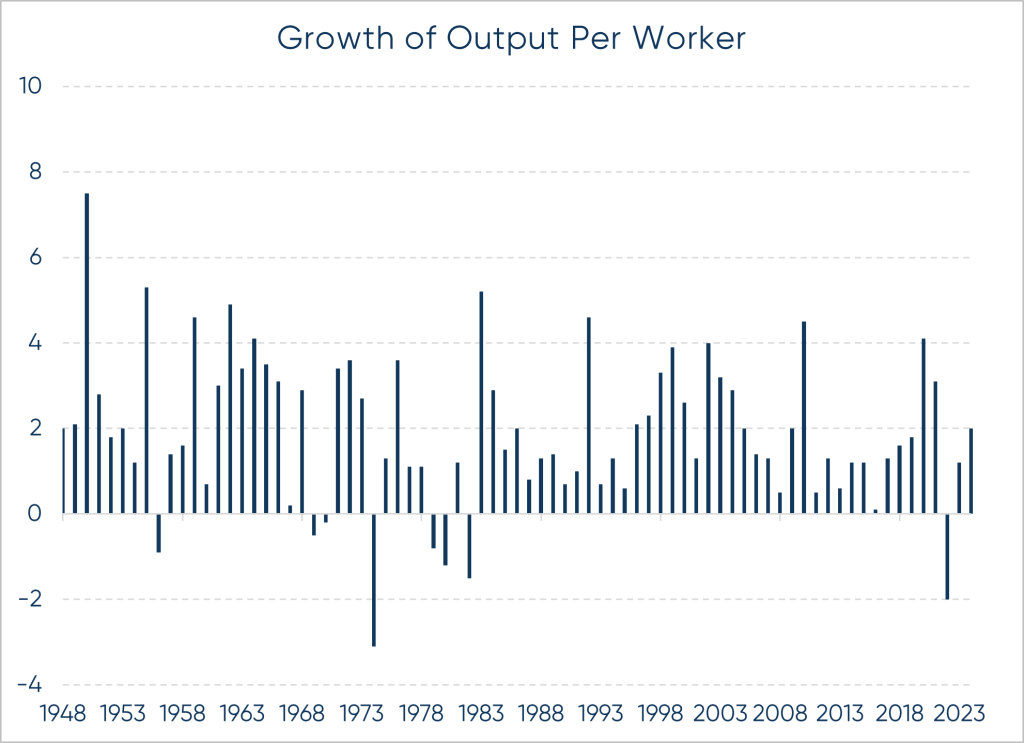
If the economy does remain solid—or accelerate some as the previous paragraph optimistically intimates—it is possible that inflation stays tame. As Milton Friedman famously said, “inflation is always and everywhere a monetary phenomenon.” Translated: it is too much money chasing too few goods. By stimulating investment and jobs, productivity can rise, and the supply of goods hopefully grow at least as quickly as demand. This is a balancing act that could result in stable or even slightly lower inflation levels, which would allow the Fed to reduce short-term rates some. Additionally, and importantly, just as the internet build-out led to higher productivity in the late 1990s and early 2000s period, AI has similar potential to similarly increase productivity.

Prospects for a New Productivity Upswing: Evidence from Historical Periods1

Growth of Output Per Worker

As we write, markets are anticipating the Fed to cut short-term rates by 25 basis points two more times by September 2026. Normally, when the Fed reduces short-term rates, mortgage rates and other borrowing costs fall as well, stimulating further economic growth. Our fingers are crossed that this benign environment can eventuate as it would likely not just be good for short-term interest rates and the economy, but also for the bond and equity markets.

The Setup: Deficits, Tariffs, and Inflation

Much of what we hear on tariffs is that they are likely to be over-turned ruled by the U.S. Supreme Court. It isn’t clear whether the government would be required to provide refunds, but tariffs are unlikely to be allowed as structured today. We fully expect the administration to implement a revised version of tariffs under a new executive order, using different emergency powers or trade acts. Regardless, we expect that we’ve seen the worst of the tariff and that is a good thing. With that policy backdrop, the key market question is what all of this means for inflation and interest rates.

In general, bonds are pretty simple. If a three-month Treasury bill yields 4% and rates are not expected to decline, then a six-month T-bill will typically yield a little more than 4% due to the slightly longer duration. The same principle applies to a 12-month T-bill relative to a 6-month and extends all the way to the 30-year Treasury bond. When investors expect rates to rise or fall based on expected changes in future inflation, the shape of the yield curve can change. Lower rate expectations typically bring the entire interest rate curve lower and vice versa.

So, the yield curve is mostly math plus expectations, which brings us to our biggest concern about long-term rates today: how much debt the U.S. will issue, and what investors will demand to finance it.

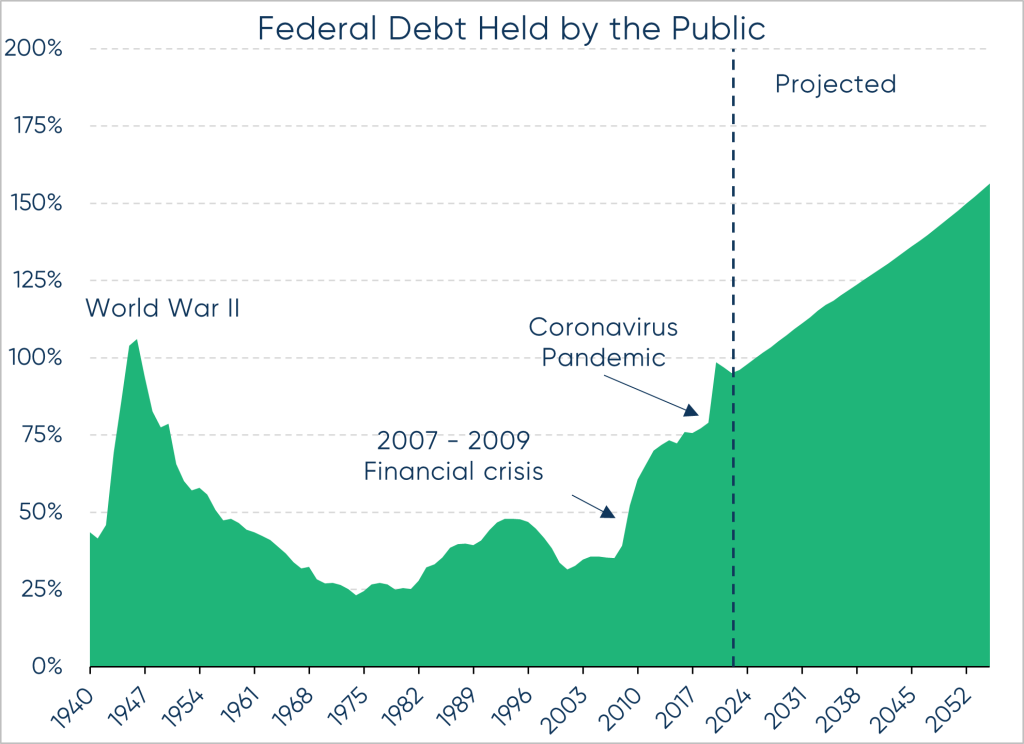
The massive pile of U.S. debt continues to grow, reaching $38.4 trillion by year-end 2025. According to the Congressional Budget Office (CBO), debt growth of $1.9 trillion in 2025 will accelerate to $2.6 trillion by 2035, with total debt expected to reach $138 trillion by 2055. At the current pace, we are expected to add $100 trillion in debt in the next 30 years. This level is expected to equal an estimated 156% of GDP in 2055, up from approximately 100% today! In our minds, this is not sustainable.

This also explains why markets are nervous about U.S. dollar risk. Historically, rather than make the hard decisions about how to balance a country’s budget, politicians have taken the “easy” path—inflating their way out. Devaluing the currency hurts everyone, but bondholders get hurt the worst as they are repaid in less valuable currency than expected. This simple fact keeps us nervous about letting our duration get too long. We remain cautiously positioned today at 4.25 years versus roughly 6.10 years for the Bloomberg Aggregate Index.

All this said, any progress on lowering inflation would be good for bond prices, and if the OBBB were to help bring some balance to government financing, it could lead to lower interest rates than we currently expect. The reasonably low starting interest rate of 4.1% on the 10-year Treasury, however, causes us to believe that even in that environment, extending duration is unlikely to prove helpful for future returns. As we’ve said before, if/as rates move higher, we would be inclined to extend our duration marginally.

The Deficit is Rising Higher and More Quickly than Ever Before2

Federal Debt Held by the Public

Another factor shaping the longer-term outlook for inflation and interest rates is the scale of investment our trading partners have proposed in the U.S. Many of these commitments may take years to materialize—if they materialize at all—but those that do could influence growth, inflation, and capital demand well beyond this administration.

A meaningful share of this spending is likely to support the physical build-out required to stay competitive in AI. Leadership in AI will require far greater power generation and grid capacity. Current estimates suggest that roughly $1.1 trillion will need to be invested by 2029 to meet projected AI-driven electricity demand of 123 gigawatts by 2035, up from 4 gigawatts in 2024. Progress on permitting and regulatory reform—also promised in the OBBB—will be critical to enabling this build-out.

AI: Middle Innings or Bubble?

Our optimistic equity outlook has served us well over the past three years. As we enter 2026, we remain constructive, but with greater caution. We expect a more two-sided stock market, with larger swings both up and down, ultimately pointing to mid-single-digit gains. That said, outcomes could deviate meaningfully: a strong or weak finish could shift returns by 20% in either direction, or we could simply be wrong in our assessment. Let us explain.

The late-2022 announcement of ChatGPT may have been the catalyst for the 2023 advance and has continued to power markets since. Elon Musk recently claimed that in 10-20 years, work will be optional, like growing your own vegetables is today. Not mandatory, but a choice. He believes AI and robotics will create an “age of abundance” in which goods and services become nearly free. While this may or may not prove true, it has investors thinking that the rewards of backing the right companies could produce huge profits in the stock market. The largest and most profitable companies in the world are now spending more on building out datacenters and AI capabilities than would have been imaginable just three years ago. Each company views winning in the AI race as existential.

Something similar happened 30 years ago when the internet captured investors’ imaginations. A group of tech companies spent heavily to build out the internet. It ended up producing enormous benefits for society, but also a bubble in stock market values that later collapsed. The leading stock at the time, Cisco Systems, rose to $82 per share in March 2000 from $0.14 in January 1991. While Cisco has been a successful company over the last 25 years, it has yet to reclaim its 2000 high.

This concern exists today for some of the leading AI companies. After three years of strong gains, we expect to glean some clarity in 2026 on whether or not this technology and these companies are real and can change the world, or whether this is another bubble similar to the internet boom. We expect more back and forth in 2026 than we’ve seen to this point.

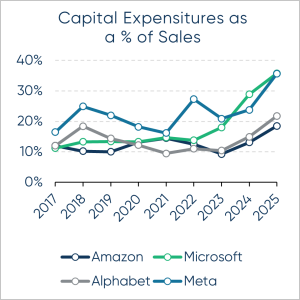
Mag 7 valuations are elevated and have pulled overall market valuations higher. Strong earnings growth has thus far justified the premium, with expectations for continued growth into 2026. As long as these companies deliver, both they and the broader market can keep moving higher. The risk, of course, is that growth slows. High valuations, paired with moderating earnings and significant capital spending, would represent a headwind for both the group and the broader market.

At some point, that scenario is likely, but we believe we are still in the middle innings of the AI cycle, not the later ones. Ultimately, AI has the potential to become ubiquitous in cars, robots, and beyond. If GDP is a function of the size of the workforce multiplied by productivity, and robots can increasingly perform human tasks, then GDP growth could rise well beyond current limits. Such an outcome could usher in an age of abundance marked by stronger growth and lower inflation.

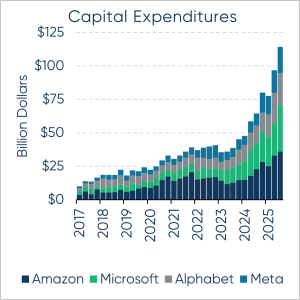
That doesn’t mean stocks will go straight up. We expect this year will be more two-sided, with the bull argument and the bear argument each dominating at different times. All the talk about what AI can and will do will be more carefully scrutinized by investors. The massive sums of capital being invested will need to produce returns to justify further investment. Without justification, investors may move to the sidelines, and the stocks could decline. Capex projections for hyperscalers in 2026 are approximately $550-600 billion. Including other participants, capex could reach as much as $2 trillion by some estimates. Without signs of broader adoption across corporate America and beyond, this level of spending will likely trigger a retrenchment in stock prices.

Balancing Elevated Valuations with Record Capital Spending3

Capital Expenditures as a % of Sales

It’s hard to be certain how the year may unfold, but we do believe one side of this debate may be in vogue for a time, only to be replaced by the other later in the year. This dynamic could repeat more than once. When we get to the end of the year, we don’t think it will be “decided”, but we do think we will be closer to understanding whether AI is a bubble or possibly the most important development of our lives.

Regardless, we start 2026 with very high valuations and expect that downside moves could be larger than we’ve seen in a few years. We are also aware that the last three years have been particularly strong, producing three-year compound SPX returns north of 20%. The last periods with comparable returns were 2021 and 1999, which were both followed by bad equity markets in 2022 and 2000. This doesn’t mean stocks will fall but does remind us that if fundamentals do change, markets have come a long way and could retrace some of those gains. In the end, modest inflation, an easing Fed, a resilient consumer, and expected low-double-digit earnings growth cause us to believe that when we ring in 2027, we will be capping another positive year—though possibly one that requires some hand wringing along the way.

Finally, on this subject, we regularly remind ourselves that markets are rational, even if investors sometimes are not. The market looks forward and discounts earnings back to a current value of expected future earnings discounted back at an appropriate risk-adjusted rate. High current valuations are not a reason to sell stocks, but they are a good indication that if expectations are not met, the potential downside may be larger than average. As long as the future continues to get brighter, stocks can continue to rise.

The more investors doubt that stocks can rise, the more cash on the sidelines waiting for a pullback. If stocks don’t pull back, then one by one those sidelined investors re-enter the market and push prices higher. Once everyone (proverbially) is fully invested and conditions change, that is when the market peaks and begins its decline. This is what makes calling tops so difficult.

As we move through 2026, we won’t be trying to call a top per se, but we do hope to rebalance out of winners and into underperformers, and vice versa, at appropriate times. Rebalancing and dollar cost averaging are your friends. We try not to forget that.

Today’s Positioning

Today we remain fully invested and broadly aligned with our strategic asset allocation targets for our client portfolios. We are not taking any meaningful geographic over- or underweights versus well-known indices. Within equities, we hold a modest overweight to healthcare—a sector that has lagged in recent years but one we believe could benefit from AI adoption. We also think RFK-related concerns have largely peaked, creating room for valuations to improve. Our position in the Mag 7 is roughly market weight; these companies continue to generate substantial cash flow to fund future investment, and in our view, at least one or two are likely to be long-term winners if AI unfolds as expected.

In fixed income, we continue to run short duration and maintain a slight underweight to the U.S. dollar, given our fiscal concerns.  Our hedge fund portfolios are again expected to provide better returns with similar or better ballast than fixed income.

2025 was another good year for markets—the third in a row. Here’s to a solid 2026 as well, even if we expect a bumpier path and a few more lead changes along the way.

As always, we greatly appreciate the opportunity to manage your capital and help you achieve your organization’s goals. We are here to assist so please feel free to reach out with any questions or needs.

Your TIFF Investment Team

Past performance is no guarantee of future results and the opinions presented cannot be viewed as an indicator of future performance. There is no guarantee that any particular asset allocation or mix of strategies will meet your investment objectives.

The materials are being provided for informational purposes only and constitute neither an offer to sell nor a solicitation of an offer to buy securities. These materials also do not constitute investment, legal or tax advice. Opinions expressed herein are those of TIFF and are not a recommendation to buy or sell any securities.

These materials may contain forward-looking statements relating to future events. In some cases, you can identify forward-looking statements by terminology such as “may,” “will,” “should,” “expect,” “plan,” “intend,” “anticipate,” “believe,” “estimate,” “predict,” “potential,” or “continue,” the negative of such terms or other comparable terminology. Although TIFF believes the expectations reflected in the forward-looking statements are reasonable, future results cannot be guaranteed.

Footnotes

  1. Federal Reserve Bank of San Francisco, data on growth of output per worker.

  2. Congressional Budget Office, federal debt projections.

  3. Company disclosures and Wall Street Journal reporting.

3rd Quarter 2025 CIO Commentary

Executive Summary

  • U.S. exceptionalism remains intact: We continue to see the U.S. as the world’s economic leader and believe equities remain the most resilient long-term store of value. We are mildly underweight bonds (both notional and duration-adjusted) given fiscal concerns.
  • What other markets teach us: Argentina and Turkey’s stellar local-currency returns are not signs of economic health; currency depreciation tells the fuller story. When translated to USD, their markets no longer outpace the U.S./ACWI, yet equities there still delivered positive real-asset exposure through turmoil.
  • Deficits and dollar risk warrant attention: The U.S. must sell roughly $2T of new debt each year. If foreign demand wanes, rates could rise and the dollar could weaken. That would slightly reduce the appeal of U.S. stocks for foreign buyers and could pressure bonds.
  • Practical safeguards: Sensible steps include reviewing dollar exposure, maintaining global diversification, and holding proven real-asset hedges like gold; bitcoin may also play a limited role for some. Even so, owning equity remains the most universal hedge against inflation and currency decay.
  • Current positioning: After ~30% gains from April lows, we are at target equity exposure and carry modest equity puts as inexpensive insurance into typical September–October chop.

U.S. Exceptionalism, Risks, and the Case for Equities

Despite unsettling headlines, we believe United States exceptionalism endures. As we wrote last quarter, we believe the U.S. will remain the economic leader of the world for the foreseeable future and that leadership will continue to translate into strong long-term returns. While U.S. fiscal deficits and potential pressure on the dollar deserve attention, and those concerns cause us to be mildly underweight bonds (on both a notional and duration-adjusted basis), we still see equities as an effective and resilient long-term store of value.

Lessons from Abroad

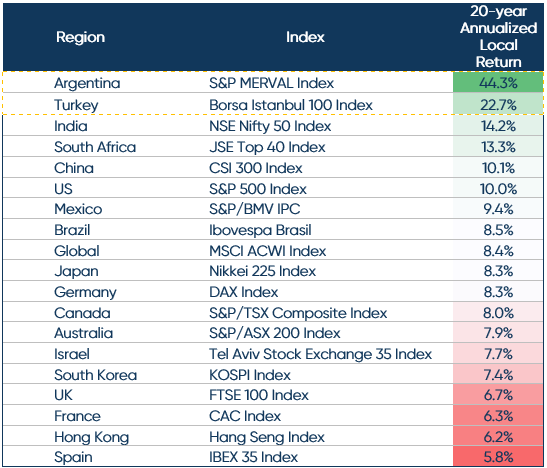
Below is a table of the best-performing stock market indices over the past 20 years, with returns denominated in local currency. For comparison, we have also included the S&P 500 and the MSCI All Country World index (both denominated in U.S. dollars). As shown in the table below, ACWI and the SPX have produced compound returns over that stretch of 8.4% and 10.0%, respectively, which is better than most investors expect going forward.

Net Total Return Local Index (Net of Dividends) Ended July 31, 2025

Net Total Return Local Index (Net of Dividends) Ended July 31, 2025
Source: Bloomberg, MSCI, and S&P Dow Jones Indices. Net Total Return Local Indices, 20 years ended July 31, 2025.

The two top-performing markets on this chart, Argentina and Turkey, have significantly outperformed the global and U.S. benchmarks, but their story is not one of economic strength.

Argentina’s experience is instructive. Chronic fiscal deficits, runaway inflation, and repeated currency crises drove the peso from roughly 3 per U.S. dollar to roughly 1,400 to 1! Over the past 20 years, living standards have fallen sharply, savings have been destroyed, and confidence in the currency has evaporated. In recent years, the peso lost nearly all credibility as a store of value, with many Argentines preferring to transact in U.S. dollars or other hard currencies whenever possible. This cycle of crisis and inflation repeated multiple times over two decades, preventing lasting stability and demonstrating the importance of strong fiscal and monetary institutions for currency stability.

The U.S. Dollar and Deficit Risk

However, the U.S. is not Argentina. Our institutions are stronger, our economy far more dynamic, our currency is still the world’s reserve, and most major commodities are transacted predominantly in U.S. dollars. That said, persistent deficits create risks. The U.S. government must sell roughly $2 trillion in new debt each year. If foreign demand weakens, higher interest rates and downward pressure on the dollar could follow—reducing the appeal of U.S. debt and eroding purchasing power for bondholders.

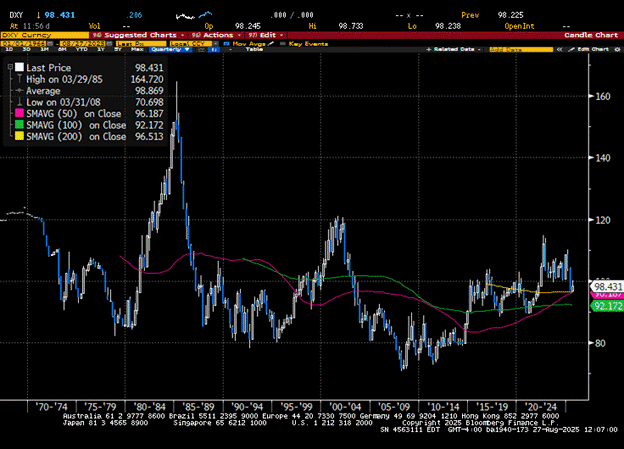
The chart below shows the long-term trend of the U.S. dollar (with DXY measuring its general international value by averaging its exchange rates against major world currencies). Today the dollar sits near its long-term average value versus major peers, suggesting to us that the U.S. dollar is somewhere near fairly valued. Confidence remains solid, but fiscal discipline will matter.

We are concerned that if the fiscal situation is not addressed, three impacts may follow. First, the U.S. dollar could depreciate, which would imply that we, as global investors, should increase our international holdings—a step we have not taken to date. Second, the U.S. stock market could become marginally less attractive as foreign investors worry about stock market gains being offset by currency losses. Finally, bonds could sell off, in some cases materially.

The U.S. Dollar and Deficit Risk
Source: Bloomberg, U.S. Dollar Index (DXY), Dec. 1969–July 2025.

Ways to Try and Safeguard Your Capital

Investors do have potential shelters to turn to. Throughout history, investors have looked to real assets when currencies waver. Gold, for example, has risen nearly ninefold over the past 20 years, roughly matching the performance of U.S. stocks. Bitcoin, though newer and more volatile, has also gained some acceptance as a store of value outside government control.

While we believe modest portfolio adjustments, such as examining dollar exposure, maintaining a global portfolio, and owning “safe havens” like gold and bitcoin as a hedge against possible dollar depreciation may be beneficial, we still view equities as the most practical and universal hedge. Investing in stocks may be the simplest way to hedge against inflation, however, because stocks offer exposure to real economic growth, pricing power, and global demand. They allow holders to participate in the hard work and innovation of employees and to benefit from the pricing power that companies can exercise.

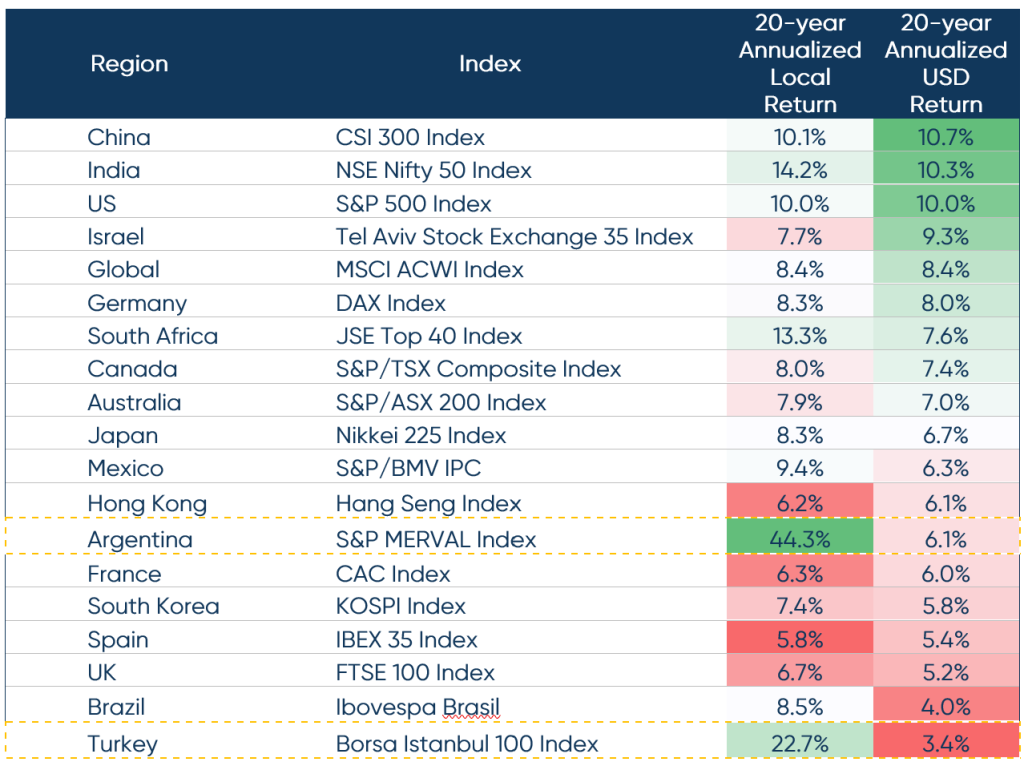
The same chart from above, with returns adjusted into U.S. dollars (see below), shows Argentine and Turkish stocks no longer exceeding the U.S. or ACWI. Yet even these countries’ economically challenged markets have delivered positive returns in the face of massive uncertainty. Unlike bonds, which can be eroded by inflation and currency depreciation, equities have shown resilience—even in countries facing deep crises. And global investors tend to reprice companies toward fair value, creating a natural hedge against local currency weakness.

Net Total Return Index (Net of Dividends) Ended July 31, 2025

Net Total Return Index (Net of Dividends)
Source: Bloomberg, MSCI, and S&P Dow Jones Indices. Net Total Return Indices (local currency and USD), 20 years ended July 31, 2025.

This is not to suggest that buying stocks in markets with depreciating currencies is the first choice of global investors. Other risks—such as political stability, capital controls and other governmental intervention—can cause large swings in realized returns over certain periods. It does suggest, however, that if it is possible to make money in equities in Argentina and Turkey in both local and U.S. dollar terms, then it certainly is possible to remain confident even when some pundits claim America has lost it exceptionalism or that foreigners may no longer want to own U.S. assets the way they once did. Stocks are still the asset we consider the most resilient and reliable generators of superior long-term real returns. And we fully expect the United States to maintain the conditions for companies to flourish here.

Our Positioning Today

Markets have been very kind for the past four months, gaining 30% from April’s lows. While we remain constructive and fully at target equity exposure generally, we are mindful of seasonal volatility and policy uncertainty. Historically, if something is going to go wrong, it tends to happen in September or October. As a result, we hold modest equity puts as inexpensive insurance.

Looking beyond the near term, we see supportive conditions for equities. November and December have historically been the strongest back-to-back months of the year. A combination of “revolutionary” new technology (AI), a decent economy, and an easing Fed could be a terrific recipe for higher stock prices.

Closing Thoughts

We remain confident in the United States’ global leadership position, cautious on government debt (including that of the United States), and constructive on equities as the most reliable source of long-term real returns. Deficits and dollar risks should not be ignored, but history and evidence suggest that owning businesses—through equities—remains the best way to preserve and grow wealth over time.

As always, we greatly appreciate the opportunity to manage your capital and help you achieve your organization’s goals. We are here to assist in any way possible, so please feel free to reach out to us with any questions or needs.

Your TIFF Investment Team

The materials are being provided for informational purposes only and constitute neither an offer to sell nor a solicitation of an offer to buy securities. These materials also do not constitute an offer or advertisement of TIFF’s investment advisory services or investment, legal or tax advice. Opinions expressed herein are those of TIFF and are not a recommendation to buy or sell any securities.

These materials may contain forward-looking statements relating to future events. In some cases, you can identify forward-looking statements by terminology such as “may,” “will,” “should,” “expect,” “plan,” “intend,” “anticipate,” “believe,” “estimate,” “predict,” “potential,” or “continue,” the negative of such terms or other comparable terminology. Although TIFF believes the expectations reflected in the forward-looking statements are reasonable, future results cannot be guaranteed.

2nd Quarter 2025 CIO Commentary

Executive Summary

  • Q2 saw significant market volatility, including an 18.9% S&P 500 drop over 49 days—comparable only to COVID-19, the Lehman collapse, and the 1929 Crash—though markets have since rebounded as investors price in more optimism than media and expert commentary suggests.
  • The U.S. fiscal outlook is deteriorating, with the “One Big Beautiful Bill” projected to increase the federal deficit by $2.7 trillion over the next decade, and a sustainable path will require multi-pronged, gradual deficit reduction over many years.
  • Foreign investors are beginning to question U.S. exceptionalism due to expensive markets and a strong (but weakening) dollar.
  • Despite negative headlines, economic fundamentals remain solid: Q2 GDP is forecast at 3.4%, job creation continues at 120k/month, inflation has eased to 2.4%, and wage growth exceeds inflation—suggesting resilience and room for cautious optimism.
  • Tariffs remain a risk with Trump’s planned July 9 actions, but TIFF anticipates they will be diluted and resolved by year-end.
  • Proposed endowment tax changes (raising the rate to 8%) could force institutions to seek greater liquidity and rebalance portfolios, creating short-term buying opportunities and increased access to top-tier private equity and hedge fund managers.
  • TIFF’s portfolio remains close to its strategic allocation (65% equities / 20% hedge funds / 15% fixed income), with neutral regional and sector exposures and a strong focus on manager alpha to drive returns.

It’s Not Over Yet

We have been expecting above-average volatility, and we got it this quarter. DOGE appears to have ended with very little actual budget impact and Trump’s proposal for next year’s budget has done nothing to help the deficit trajectory. The Congressional Budget Office (CBO) estimates that if enacted, this would add $2.7 trillion to the federal deficit over the next 10 years. Most other reputable forecasts are somewhat higher than this estimate, but when the baseline is $21.1 trillion, the increments seem less significant. The US remains on an unsustainable path unless meaningful steps are taken to address rising debt and persistent deficits. We have been numbed from the exorbitant levels since the Great Financial Crisis. The largest ever annual deficit before 2008 was -$413 billion (a huge number itself!) with a median deficit of ~-$200 billion. The smallest annual deficit since 2008 was -$438 billion, with a median of ~-$1.1 trillion (2024 is estimated at -$1.9 trillion). That represents 6.5% of estimated GDP—in a decent economy! But comparing the deficit to the overall GDP mixes an “income statement” loss (deficit) to a related, but merely referential, total economic number (GDP). A fairer comparison is to compare the deficit to the actual revenue of the government of roughly $5.0 trillion in 2024. On that basis, the US is spending roughly 40% more per year than it receives in receipts.

The Congressional Budget Office Estimates a $2.7 Trillion Deficit Impact by the One Big Beautiful Bill Act, as Passed by the House of Representatives on May 22, 20251

We need to take action to try to get off this path, potentially soon. Time is running out. Getting out of this will be like shortening a 3-legged stool. You can’t cut one leg off, or the stool tips over. The only way to do it is to shorten one leg by two inches, another by two inches, and finally, the third by two inches. You repeat this process as many times as needed to achieve the desired height. It will likely take a decade or more for our country to return to something that can be sustained for future generations.

Success for the US economy will look something like 3% GDP growth, a budget deficit of 3% of GDP (so that as a percent of GDP, the debt quits growing—similar to how each of us can handle more debt as our income and assets grow). Throughout this, we need to keep productivity high, which means inflation must also remain under control. This is a tall task, for sure, but one we must attempt to tackle. The sooner the better; the later, the more painful. Markets can move quickly and violently to impose discipline, as observed in 2022 in the United Kingdom.

The big question, then, becomes whether the proposed budget, if passed, will enable us to achieve this target. We don’t know. Will it break the proverbial stool? Can we stay on track and not give up along the way if it (or something else) can get us there over some number of years? This is the challenge of our times. Whether it’s this or some other plan, we need to become unified in our goal of improving our financial situation. If we don’t, the capital markets will, and possibly in a much less comfortable way.

The continuing deficit is one of several reasons that the markets today are asking if US exceptionalism is over. Other concerns include expensive US capital markets relative to other countries and a potentially overvalued dollar. Believers are speculating that this means the US is, therefore, a less attractive investment destination for foreigners, who may be starting the process of bringing some of their capital back home. If true, this could be a long, slow process that pushes the US share of global stock markets (65%) down toward something closer to our share of global GDP (25%). It won’t happen all at once, and it won’t likely push our share of markets that low, but directionally, it would mean that other markets will mostly outperform ours for years to come. If the USD also loses global purchasing power, then Americans planning a European vacation will need to save a little more than they do today. As believers in the US and our economy, we remain adherents to Warren Buffett’s suggestion to “Never bet against America.” As global investors, we also have an ever-changing benchmark and will therefore not get too far out of step with whichever path proves correct in the coming years.

US Dollar Index Against a Basket of Currencies Has Shown Strength Since the Great Financial Crisis but Has Recently Dipped2

What Next

As for things more near to hand, the last quarter was the most volatile in a while. From its February 19 high to its April 8 low, the S&P 500 sold off 18.9%. According to Perplexity.ai, this has only happened in fewer days three times—during COVID-19, the Lehman collapse that punctuated the GFC, and the 1929 Crash that started the Great Depression. Not the sort of company one wants to keep. This may be why most TV news commentators, economists, and market prognosticators all sound so negative. Every night, we hear that a recession is coming along with higher inflation.

Why, during this time, are equity markets doing so much better? As we’ve said before, the stock market is a forward-looking, discounting machine. It dispassionately takes account of what is happening in the economy, politics, geopolitics, and other relevant areas, and estimates how that will ultimately impact the forward earnings of companies whose stock is traded on the exchanges. Investors are looking forward and seeing a brighter future than the prognosticators. We, too, are more optimistic.

Despite all the naysayers, the economy continues to hold up, at least so far. Real quarterly GDP growth was -0.5% in Q1 this year, primarily due to US businesses purchasing much more from abroad than they exported (likely looking to get ahead of tariffs), thus contributing -4.8% to Q1 GDP. Happily, the latest Atlanta Fed Q2 GDP forecast (based on data through June 18) is for 3.4% growth. US GDP forecasts for the year 2025 range mostly between 1.4% and 1.9%. Similarly, the number of jobs created this year continues to surprise to the upside, averaging 120k per month. This is just enough to keep the unemployment rate roughly stable around the 4.25% level. And finally, CPI inflation recently came in just 2.4% higher than last year, down from 2.9% at year-end. Meanwhile, year-over-year personal income growth through April 2025 is 2.94%. We are trying to stick to reading the numbers and not listening to more qualitative assessments. So far, at least, our read is that the economy and job creation continue to be solid, and the markets agree.

Lastly, regarding the Middle East war, our take on direct US involvement is balanced. As we write, the direct hit on Iranian nuclear facilities appears to have been successful at minimizing (still no IAEA confirmation) their potential nuclear threat for quite a while. This would be good (US stocks rose 2% in the two days after the strikes). World leaders are nearly unanimous that Iran should honor the treaty it signed and not become a nuclear power. This could portend a very positive future for the Middle East if it leads to Iran becoming a peaceful country, working to improve its citizens’ lives as most other countries in the region seem to be doing. In the short run, however, we don’t know if Iran or its proxies have cyber capabilities, sleeper cells, ballistic missiles, or anything else up their sleeves that could be used in a scorched-earth effort to remain in power. The next few months will be very important for the entire region. The good news seems to be that Russia and China are not coming to Iran’s aid (nor is anyone else), suggesting this could be the start of a brighter future for Iran and the entire Middle East.

Looking Ahead

Following his 90-day pause on “reciprocal tariffs,” Trump plans to enact specific new tariffs on 57 countries starting on July 9. If the administration’s use of current statutes is declared illegal, it will likely try other legal approaches to pursue the administration’s goal of imposing tariffs (note: we’d generally prefer not to have tariffs—as we consider tariffs to be taxes, and taxes slow the economy). For this reason, we aren’t yet out of the tariff woods. We are, however, starting to see that tariffs are very unlikely to remain anywhere near the levels Trump announced on “Liberation Day.” This is good. While July 9 may bring short-term market volatility and is unlikely to mark the end of the story, we remain confident that tariff negotiations will conclude by year-end. We also believe that in the second half of this year, Congress will pass a budget (the “One Big Beautiful Bill”) that keeps taxes low and will begin to reduce regulation. Both of these will be welcomed by markets in our opinion. As the uncertainty and, hopefully, the volatility subside, we expect to see more investors becoming optimistic about the future and stock prices working their way somewhat higher. Longer-term, AI will accelerate growth and improve the efficiency of almost everything. Self-driving cars (try a Waymo in San Francisco and you’ll love it) could become common this year, and in another few years, humanoid robots will break onto the scene. We may not all like these advancements, but businesses that embrace them will become more productive and profitable than those that don’t. This could improve GDP growth and help us get our deficit under control. We keep looking for hopeful ideas on this front, and for now, this seems to be our best remaining hope.

On the fixed-income side, our views on the deficit picture probably gave you a good idea that we still prefer hedge funds. Hedge funds should continue to perform better as a group than the Bloomberg Fixed Income Aggregate, and they provide much better alpha opportunities than fixed income. Our duration remains just short of 5 years vs. our benchmark at approximately 6 years. We would love to trim duration if yields on the 10-year Treasury get to 4.25% or below. Conversely, if yields get to 4.75% or so, we expect to add duration. We continue to anticipate the 10-year will trade in a 4.25% to 5% yield range this year. We will likely buy at the higher yields and sell at the lower yields. Interest rates will be impacted by the US budget and deficit progress (or lack thereof), as well as inflation changes—whether higher (as most expect) or lower (as a few expect). Nevertheless, there is better value in fixed income today than in many years.

Meanwhile our hedge fund portfolios continue to do well for us, and we like our manager roster. The proposals to raise the tax rate that “wealthy endowments” pay (to as high as 8%) could create opportunities for TIFF. While the opportunity is smaller now than it would have been at the originally proposed 21% rate, affected endowments may still look to reduce their tax burden. This could lead them to (1) move away from high-turnover hedge funds or (2) sell private investments now to avoid future gains taxes and create liquidity for rebalancing their private book.

Our eyes are wide open for opportunities to upgrade already strong manager rosters across all our portfolios.

For now, we remain very near our strategic asset allocation targets of 65% global equities/20% hedge funds/15% fixed income. We are also quite neutral relative to geographic and stock market sector weights, relying heavily on manager alpha to drive positive relative performance. Fingers crossed; this strategy has been beneficial so far this year, and today, we don’t see a compelling opportunity that would cause us to change from this positioning.

Where’s the Big Opportunity of the Future?

A number of people have started asking if the current chaos is creating opportunities that we believe could prove helpful in coming years. We mentioned some possibilities above when discussing how the proposed endowment tax changes could create access to new managers. Below, we will address the question in greater detail. TIFF will have our own favorite approach to tackling this potential opportunity, but our goal here is to outline which asset class/assets could generate better-than-average returns over the next 3-7 years. Let’s dig in.

Over the long run, different assets provide generally different returns. Money markets, for example, usually provide the lowest returns with the least risk and lowest volatility of annual return. Next up are bonds, where returns are usually a bit higher than money markets but they can be more volatile and you can lose money from time to time. Hedge funds are riskier and, in our opinion, higher returning investments. Public equities typically provide even higher returns, while private generally equity offers the highest return, but also carries the most risk. One of the features that makes private equity riskier than public equity is its lack of liquidity. When events conspire against the capital markets and you want to step aside, it’s only possible if your holdings are liquid. You might be able to sell your illiquid private equity holdings, but usually only at a steep discount.

This is why we own some illiquid private investments, but we try to limit our ownership to 1/3 or so of a portfolio. We like the higher expected returns but understand and incorporate the higher risk that comes with illiquidity. Others are willing to take much higher illiquid exposure than this and that could be presenting an opportunity today.

The Proposed One Big Beautiful Bill (OB3) Endowment Tax

The OB3 proposal introduces a progressive, tiered tax schedule on private higher education endowments (up to 8% from current 1.4%). We’ve written an overview of the latest Senate draft tax proposal [here] for the details. The proposal represents a substantial change in higher education taxation that, when coupled with possible modifications in other higher education governmental funding and student eligibility, could impact private markets in both the short and long terms.

In the short term, impacted investors may look to increase liquidity and rebalance portfolios. In the long term, impacted institutions may look to (1) increase their expected returns to offset the tax drag and/or (2) look to defer any potential tax liability by seeking long-hold assets.

We anticipate two possible short-term outcomes from these:

  1. Increased use of secondary markets as institutions:
    • Rebalance portfolios in light of the tax
    • Manage the increased financial burden on endowment
    • Create potentially interesting buying opportunities on the other end of those transactions
  2. Availability of capacity at some previously closed PE (and HF) managers as impacted endowments augment liquidity to new higher levels reflecting the new higher annual draw.

If this happens, we will try to add attractive managers to our roster, which we already like a lot.

Over the longer term, we expect affected endowments will find the right level of illiquidity for the new endowment environment. They will likely attempt to stay toward the higher end of target illiquidity levels by:

  1. Tilting asset allocation toward return-enhancing alternatives like private equity
  2. Preferring longer-hold assets aligning with private equity’s time horizon
  3. Minimizing annual taxes by overweighting those that generate long-term gains taxed at lower rates, rather than consistent taxable short-term gains

In addition to the long-term role private equity will play in E&F’s, the “democratization” of PE is very likely to bring retail investors into this market as new buyers. New products that allow for smaller investors to invest in illiquid assets are emerging both in the US and Europe as regulations and structures increase the range of potential investors in this space. Over time, some estimates are that up to half of illiquid demand will come from this new source. We tend to believe that retail capital will flow to larger PE firms with more fundraising resources, which could further compress returns in larger cap PE strategies. However, this should provide a boost to smaller PE managers, who will eventually sell their portfolio companies into this market and be able to capture greater levels of multiple expansion at exit.

Our main conclusion here is that traditional PE investors may right size now, but they likely won’t abandon the consistently highest-returning asset class. Meanwhile, new investors who are gaining access could become a big source of demand in the future that will benefit returns in some parts of the private markets. In our view, private equity still benefits from some structural advantages, such as the ability to align interests, add value to portfolio companies, think more long-term than many public companies, get term leverage, and choose when to be fully invested. Private equity is thus likely to remain the best performing asset class in the future.

We started by highlighting that PE generates the highest and riskiest return stream. Below is the other factor that causes us to believe that now may be a better-than-average time to invest in PE. The chart below shows the annual PE return (blue bar) and the rolling 10-year performance vs. public equities (green dots). You can see both the excellent long-term performance and the uniquely poor last two years—the worst back-to-back returns in the last 22 years. In previous episodes of poor performance, subsequent years were recovery years. So far, that hasn’t happened this time.

1 Year and 10 Year Excess Return of Cambridge Associate PE & VC Index vs. MSCI ACWI3

We are not forecasting a monster year, but we do expect that the inherent advantages of PE noted above should continue to prove valuable to returns.

There are many nuances that our private markets team incorporates into their efforts to exploit opportunities that we’ve mentioned. However, we want to go on record suggesting that we believe today is as good a time as we’ve seen to consider increasing PE exposure if it fits your plan. In our opinion, we may look back on this period in 5-7 years as an unusually good opportunity. We also note that despite our views, timing PE is notoriously difficult due to the impossibility of knowing the investing environment for the next 4-5 years and the exit environment for the subsequent 5 years or so.

As always, we greatly appreciate the opportunity to manage your capital and help you achieve your organization’s goals. We are here to assist in any way possible, so please feel free to reach out to us with any questions or needs.

Your TIFF Investment Team

These materials are being provided for informational purposes only and constitute neither an offer to sell nor a solicitation of an offer to buy securities. These materials also do not constitute an offer or advertisement of TIFF’s investment advisory services or investment, legal or tax advice. Opinions expressed herein are those of TIFF and are not a recommendation to buy or sell any securities.

These materials may contain forward-looking statements relating to future events. In some cases, you can identify forward-looking statements by terminology such as “may,” “will,” “should,” “expect,” “plan,” “intend,” “anticipate,” “believe,” “estimate,” “predict,” “potential,” or “continue,” the negative of such terms or other comparable terminology. Although TIFF believes the expectations reflected in the forward-looking statements are reasonable, future results cannot be guaranteed.

Footnotes

  1. CBO.

  2. Bloomberg. Based on DXY, which is a measure of the international value of the U.S. dollar relative to a basket of six major world currencies: the euro, Japanese yen, British pound, Canadian dollar, Swedish krona, and Swiss franc.

  3. C|A PE&VC Index, Bloomberg. C|A PE&VC Index utilized IRR while MSCI ACWI is shown in time weighted returns.
    Notes. Represents TIFF’s view of the current market environment as of the date appearing in this material only. CY 2024 C|A PE + VC is estimated at 6%. Past performance does not guarantee future results.