Market Observations
Market Summary
- Q2 2026 was a strong quarter for equities, with ACWI rallying 14.9% after a 3.2% decline in Q1 due to concerns about the US-Iran conflict.
- A combination of a ceasefire in Iran, sustained AI-related earnings momentum, and overall optimism about AI capex spend were key positive drivers.
- Early data indicates a solid quarter for hedge funds, particularly longer-biased equity long/short funds, many of which likely benefitted from AI-related exposure and possibly private company exposure to SpaceX.
- It was a weaker quarter for bonds as yields backed up slightly, perhaps due to a combination of reallocations to riskier investments after the Iran ceasefire, persistent inflation, and renewed uncertainty about the path of interest rates over the second half of the year.
- Beyond these headline results, there are several areas we are monitoring that could create a combination of both risks and opportunities over the remainder of the year.
Concentrated Leadership
While it was a great quarter for stocks overall, a small number of businesses related to AI hardware capex, specifically semiconductors and memory companies, carried the market. The table below summarizes performance, valuation, and return contribution statistics for just the top ten contributors within the semiconductor and tech hardware industry groups. Bottom line: just 20 stocks in two verticals within tech were responsible for half of the overall index return. Except for Apple and Nvidia, these stocks were up close to 100% on a capital-weighted average basis on the quarter (five of these stocks were up over 200%). As leadership has narrowed, marginal investor demand has become levered. Several asset managers have launched ETFs that hold just one of these stocks on a levered basis. One of these ETFs has grown by over $15 billion in the last six months.
Metrics For Top 10 Contributors in Two Tech Subsectors1
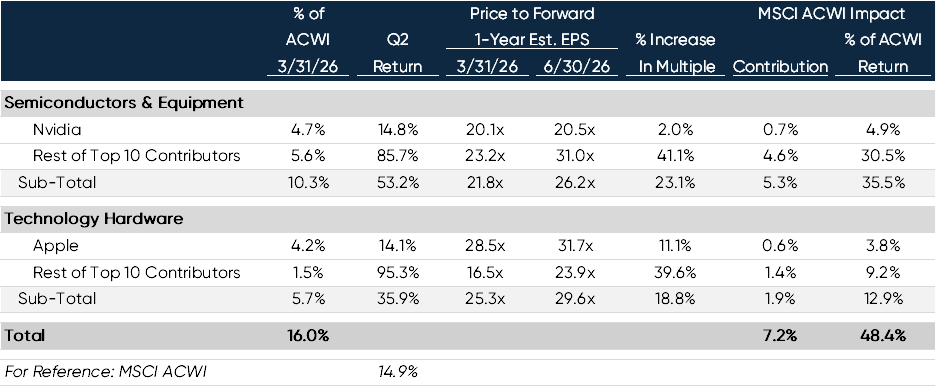
Other parts of the AI value chain have not rallied to the same extent. If the appreciation of the high performers proves to be justified by the fundamentals, we would expect these other areas to do well and the market leadership to broaden. However, if the sentiment about AI reverses or fundamentals stall, the top performers from Q2 may have a long way to fall. Some of the recent buyers are levered players, and current valuations are demanding, particularly for the more cyclical companies.
Heavy Forward IPO Calendar
The second market dynamic we are monitoring is the potential impact of several very large IPOs. SpaceX completed its $86 billion offering (including greenshoe) on June 12 and currently trades at a total valuation of over $2 trillion. In addition, the market expects Anthropic and Open AI to complete IPOs over the next few months. The exact sizes of the offerings and company valuations are unclear, but both are expected to raise at least $60 billion dollars and trade at greater than $1 trillion valuations. IPOs of this size are unprecedented. These three mega IPOs are also unusual because the percentage of the total shares sold at the IPO are well below average. Most IPOs are sales of roughly 20% of the total shares. SpaceX sold only 5%.
Shares not sold in an IPO are typically restricted from trading for six months after the offering, meaning that for these three mega IPOs, in addition to the very large amount of dollars raised on the IPO dates, there is also an unusually large backlog of subsequent shares that will come off lock-up between six and twelve months later. The chart below summarizes this dynamic.
US IPO Proceeds & Insider Lock-Up Releases as % of Jan 1 Market Cap (1990-2027)2
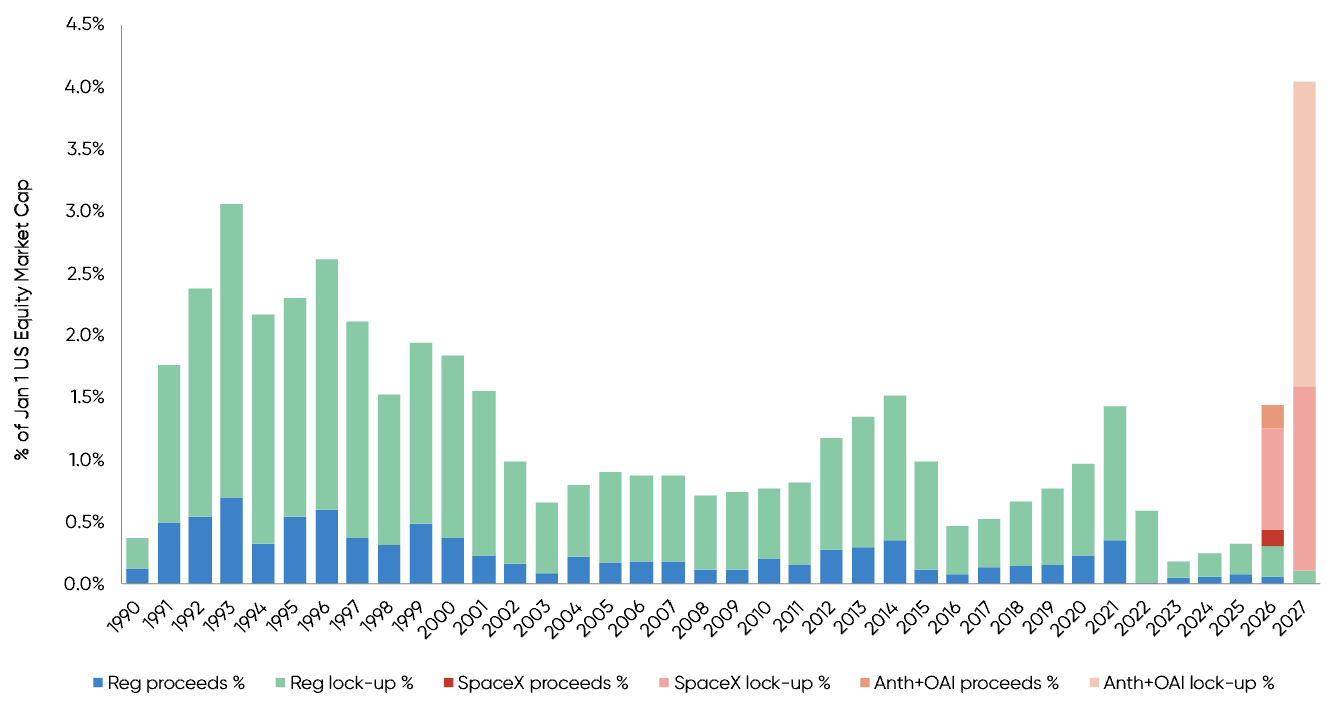
The blue bars represent actual IPO proceeds from the past few decades. The green bars represent shares released from lock-up following those prior IPOs. The red and orange bars represent shares coming to market associated with the “big three” mega IPOs of 2026. Importantly, this analysis likely understates the aggregate value of the supply coming to market for two reasons:
- It ignores potential 2026 and 2027 IPO volume from other companies (difficult to predict, though we know that other private companies are considering IPOs).
- It assumes that the shares coming off lock-up are valued at the original IPO price.
If the offerings are successful, the actual value of the shares following the lock-up period may be significantly higher. IPO activity over the past few years has been well below average. However, there will need to be significant demand from public investors for the “big three” new offerings over the next year for them to trade well. Absent a big cash infusion in the form of dividends or share buybacks, raising enough cash to buy shares of the “big three” may put downward pressure on other parts of the equity markets.
Long-term Impact of US-Iran Conflict
We are giving a lot of thought to the long-term impact of the US-Iran conflict on oil prices and the energy markets. As for oil prices, they are likely to stay below $100 / barrel over the short term if traffic out of the Strait of Hormuz can return to normal. Longer term, there is a possibility that oil prices will continue to decline or at least be much less impacted by geopolitical conditions in the Persian Gulf. We see parallels to the onset of COVID, when a shock to the system caused multiple market participants to re-evaluate and ultimately restructure their supply chains. Recent events may cause both suppliers and consumers of oil to reassess their supply chains. Exporting nations in the Gulf are likely to explore alternative distribution routes via pipelines that enable them to bypass the Strait entirely for a greater percentage of their total volumes. Increasing pipeline capacity will be costly and time-consuming but may be worthwhile. Similarly, importing countries, particularly in East Asia, are likely to accelerate their efforts to electrify their transportation networks and other infrastructure to reduce their dependency upon a single region for a critical input. These adjustments would be supportive for a combination of electric vehicles, batteries, certain metals, power infrastructure, and construction-related businesses. We also have seen somewhat greater support of exports by formerly sanctioned countries such as Russia, Iran, and Venezuela.
A Co-CIO Conversation: Risks We Are Watching
As we continue working together in TIFF’s Co-CIO structure, we have been focused on which risks are most likely to matter for portfolios in the second half of the year.
Markets have performed well, supported by solid GDP growth, positive employment trends, and easing inflation pressure as oil prices normalize following the Iran conflict. This provides a constructive backdrop for risk assets. At the same time, the questions ahead are becoming more complex: Will the AI buildout put upward pressure on inflation before productivity benefits emerge? Will equity leadership broaden beyond a narrow group of large-cap technology and AI-related companies? Will the expected IPO calendar affect the supply/demand balance for capital in public markets? Will the results of the mid-term elections be well received by the markets?
These are important questions, but they are questions that can be analyzed through fundamentals, valuations, positioning, and market structure. The harder question to answer is how shifts in policy, regulation, fiscal priorities, or geopolitical posture could affect markets. That risk does not lend itself as easily to scenario analysis, but it has meaningful potential to affect the market’s current trajectory. Against that backdrop, we are also watching whether consumer spending and employment remain resilient, whether the path of interest rates continues to pressure valuations, and whether stress in parts of the credit markets remains contained. These considerations are central to how we are thinking about portfolio construction in the second half of 2026.
— Trevor Graham and Jay Willoughby, Co-Chief Investment Officers
Performance, Positioning and Research Priorities
Performance
We expect the liquid portions of our portfolios to range between 1% ahead (most accounts) and 1% behind the public market equivalent benchmark (e.g., 65/35) for Q2. In Public Equities, we will likely end up trailing the benchmark. The largest detractor from performance was from security selection within technology. Our managers have been slightly overweight software and slightly underweight semiconductors and hardware. Given the sharp moves in the latter categories, these small deviations from the benchmark are creating much more noise than they would in a normal environment. The drag from suboptimal tech positioning within our fundamental managers has been offset by outstanding event-driven results in biotech and solid excess return from our multi-manager platforms. Within Diversifiers, our results will likely be well ahead of the Bloomberg Aggregate Index but behind the HFRI FOF Index. We note a somewhat anomalous result in the HFRI Fund of Funds Index. This index usually performs with a beta to equities of about 0.3. The quarter-to-date results that we have as of this publication show HFRI as capturing closer to 55% of the equity market’s return. The result could be due to unusually high alpha (maybe some pre-IPO investments in SpaceX?) or perhaps it is due to net long exposure drifting upwards. Either way, we have decided to maintain the roughly 0.3 equity beta posture of our own portfolio due to the role we want Diversifiers to play, particularly in tougher environments. Positive contributors to results included our systematic strategies, recoveries in our carbon credit positions, and equity long/short managers focused on technology, Europe, and Taiwan.
Most importantly, our overall long-term results continue to be ahead of benchmarks in most time periods.
Positioning
We have not made material adjustments to our basic exposures within Public Equities or Diversifiers. Within Public Equities, we continue to be near the benchmark across geography and sector exposures. However, we have introduced a risk-management tool to reduce factor risk. We have managed geography and sector risk internally with a combination of simple, readily available ETFs, and futures for decades. Managing style factors is not as easy. After a lengthy, multi-year research and testing period, we have added a market-neutral basket of single stocks designed to neutralize more complex unwanted style factor risk. We have been rebalancing this basket monthly as we receive updated holdings from our managers. This adjustment is designed to reduce the portion of our equity tracking error that comes from unintended factor exposures, such as momentum or volatility, and increase the portion that comes from idiosyncratic security selection. This adjustment should result in more consistent excess returns over time.
In early Q2, we added Topwater to portfolios where we believed the strategy fit the portfolio’s objectives. Topwater is a capacity-constrained multi-manager platform with outstanding risk management. We have tracked this manager for years and finally got a chance to invest when a large LP redeemed.
Forward Research Calendar
The team is working on several projects that we expect to reach a conclusion over the second half of the year. We have been researching activist strategies in Japan for the past several years and we expect to add multiple managers in this area over the next quarter. In addition, we are in the late stages of diligence on a new multi-manager platform that we believe may have a competitive advantage in data. In Diversifiers, we are likely to shift some capital to systematic strategies in anticipation of a higher volatility equity environment. These managers tend to have higher turnover than the fundamental managers and adjust their portfolios more quickly.
Beyond manager research, we are working on a project to better evaluate our overall exposure to AI-related businesses. As one of the major growth drivers in the economy, there are now material elements of AI-related exposures across power, energy, utilities, industrials, and business services. Total exposure is a nuanced issue that is not easily quantified with traditional GICS categories. Depending on our findings, we may make some exposure adjustments over Q3.
Recent Firm Highlights
We recently held the final close for our latest private markets direct fund, a strategy that invests in private businesses alongside independent sponsors rather than allocating to private equity funds. The fund was oversubscribed and closed at its hard cap of $300 million. We are currently in the market with our next series of private equity and venture capital fund of funds.
In June, Andrew Murray and Stephen Grau joined TIFF to lead our efforts in private equity secondaries. TIFF has been an active participant in this market for years as both a buyer and a seller, and we believe the combination of limited distributions over the past three years and continued growth in the private equity market has created an attractive investment opportunity. Given that backdrop, we believe our portfolios will benefit from dedicated resources in this area. Read the full press release, here.
We look forward to seeing many of you in Boston on October 28th and 29th at the 2026 TIFF Investment Forum. Thank you for your ongoing partnership and best wishes for a great summer.
These materials are being provided for informational purposes only and constitute neither an offer to sell nor a solicitation of an offer to buy securities. These materials also do not constitute an offer or advertisement of TIFF’s investment advisory services or investment, legal or tax advice. Opinions expressed herein are those of TIFF and are not a recommendation to buy or sell any securities.
These materials may contain forward-looking statements relating to future events. In some cases, you can identify forward-looking statements by terminology such as “may,” “will,” “should,” “expect,” “plan,” “intend,” “anticipate,” “believe,” “estimate,” “predict,” “potential,” or “continue,” the negative of such terms or other comparable terminology. Although TIFF believes the expectations reflected in the forward-looking statements are reasonable, future results cannot be guaranteed.
Footnotes
FactSet.
TIFF analysis. IPO proceeds — Jay R. Ritter / Univ. of Florida (1990–2014); EY / Renaissance Capital (2015–2026 YTD). Market cap — World Bank / Siblis Research. SpaceX actuals & lock-up — SEC S-1/A, Renaissance Capital 2Q 2026 Review, CNBC, Motley Fool, Investing.com (June 2026). Anthropic/OpenAI — company announcements, Fortune, CNBC, US News (June 2026). 2027 pipeline — Renaissance Capital IPO Outlook. The 2026 SpaceX lock-up calculation includes the conditional release share block.