Endowment Spend Policy: Why Methodology Matters

Executive Summary

  • Spend policy methodology often receives less attention than the spending rate itself, despite having an equally meaningful impact on the dollars flowing into an institution’s budget.
  • While Investment Committees and organizations carefully review the rate annually, the implications and trade-offs of the calculation methodology are often not well understood.
  • The key trade-off is between spending stability and long-term endowment growth.
  • Each organization should assess its own needs and priorities to ensure the methodology selected aligns with objectives.
  • All organizations should be aware that market factors influence each methodology differently.
  • Over its 35 years of experience, TIFF has guided clients to understand and select the best spending methodology to meet its objectives.

Rethinking Spend Policy: Why Methodology Matters More Than You Think

Spend policy methodology often receives less attention than the spending rate itself, despite having an equally meaningful impact on the dollars flowing into an institution’s budget. While Investment Committees focus on the rate carefully and annually approve it, they don’t often consider with the same rigor how the spend is calculated, even though the methodology has immense impact on the amount of dollars going into the budget on an annual basis.

Based on various studies, the trailing average market value is the most popular spend methodology.1 However, there are a multitude of other methodologies, each with their own trade-offs. A methodology will perform differently depending on the current economic environment and generally falls along a spectrum of ensuring consistency/growth of spend and protecting the endowment corpus (especially in times of drawdown).

This article provides a framework for institutions to consider their objectives and needs when it comes to their spend, and which methodology might best fit those needs.

The Three Main Types of Methodologies

Our Spend Policy 101 whitepaper gave an overview of the most commonly used and discussed methodologies. A brief summary is below:

  1. Endowment Market Value: A predetermined percent of endowment market value, often on a trailing multi-year average basis.
  2. Inflation-Based: Last year’s spend value increased by inflation, sometimes within a band.
  3. Hybrid: A combination of market value and inflation.

There are other less common methodologies that we will not discuss in this article.

Trade-offs Among the Methodologies: A Framework for Consideration

Understanding what is important to your institution will help determine the best-aligned spend methodology. These factors should be documented in an institution’s spend policy, to ensure future leaders and fiduciaries understand the choices made. Each organization should assess their organizational preferences and objectives to help determine the best spend policy.

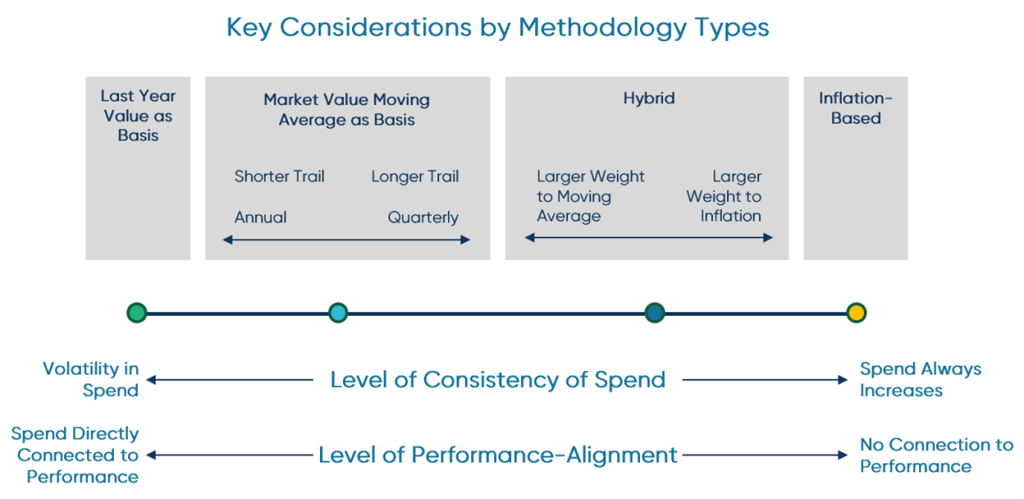
At a high level, institutions must balance institutional needs for consistency of spend value and what best helps build endowment value for the long term. TIFF has outlined conceptually where each methodology falls across these two considerations.

Key Considerations by Methodology Types
Source: TIFF internal analysis, representative view of consistency of spend.

A helpful starting point is assessing the institution’s sensitivity to changes in annual distributions. Organizations that rely heavily on endowment spending to fund their operating budget, or that have limited flexibility in other revenue sources, may prioritize policies that provide greater stability in spending levels. Institutions with more diversified or flexible funding sources may be better positioned to tolerate some variability in annual distributions in order to keep spending more closely aligned with investment performance.

Institutions should also consider their longer-term priorities for the endowment. Policies that prioritize consistency in spending can support budgeting and program stability but may require distributions during periods when the endowment is under pressure (e.g. taking out money during a market drawdown). Approaches that more closely track market performance may introduce short-term variability but can better protect the endowment’s ability to support future generations.

Key Questions for Institutions

To help an institution assess its endowment needs and what spend methodology might be appropriate, TIFF recommends focusing on the following questions:

  • How dependent is the institution’s operating budget on endowment spending, and how much variability in annual distributions can it realistically absorb?
  • If endowment spending declined meaningfully in a given year (e.g. 10–30%), how would the institution adjust its budget or operations?
  • How important is it for annual spending to grow consistently to keep pace with inflation and rising operating costs?
  • To what extent should spending be aligned with investment performance to protect the endowment’s long-term purchasing power?

This will help institutions assess their financial flexibility, reliance on endowment funding, need for predictable growth, and priority placed on endowment growth over time.

How Market Outlook Impacts Methodology

While it is difficult to predict future market and economic performance, it is important to recognize these factors, though out of any individual’s control, have an impact on the dollars in the institution’s pocket depending on the chosen methodology. While TIFF doesn’t support selecting a spend methodology based on market outlook, institutions should still be aware of the impact market factors have on their choice.

An institution can broadly anticipate each methodology to perform better in a different environment. While there are multiple inputs in the various spend methodologies, there are three key market factors across all of the approaches: (1) inflation, (2) market performance, and (3) market volatility.

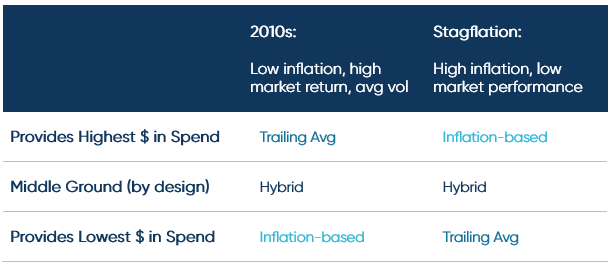
A moving average will provide the highest dollars in the withdrawal when market performance is high and inflation is low (e.g. during the 2010s). An inflation-based methodology will produce the highest spend in a stagflation environment, where the spend increases to match inflation as the markets are flat (if not down). Hybrid, as it is a blend, typically ends in the middle of outcomes between market- and inflation-based approaches.

Chart: Case Study of Market Factor Impact on Spending Value

Case Study of Market Factor Impact on Spending Value
Source: TIFF Internal analysis, representative of average approach of each type.

Conclusion

Endowment spending policy is ultimately a reflection of an institution’s financial priorities, risk tolerance, and long-term mission. While the spend rate often receives the most attention, the methodology used to calculate that spending can have an equally meaningful impact on both annual budget support and the preservation of the endowment over time. By thoughtfully considering the trade-offs between spending stability and long-term endowment growth, and by aligning methodology with the institution’s financial structure and objectives, organizations can adopt a policy that supports both present needs and future generations. A well-documented approach ensures that these decisions remain intentional and well understood by future leaders and fiduciaries.

For 35 years, TIFF has helped endowed nonprofits achieve their investment goals to support their missions. One element of that support involves providing strategic governance advice to institutions as they navigate these challenging and “no-right-answer” topics. TIFF helps guide institutions toward the answer that best aligns with their organization’s financial structure, priorities, and mission.

Other Articles by TIFF on Spending Policy

Spend Policy 101

So, You are Considering Changing Your Spend Rate

Past performance is no guarantee of future results and the opinions presented cannot be viewed as an indicator of future performance. There is no guarantee that any particular asset allocation or mix of strategies will meet your investment objectives. 

The materials are being provided for informational purposes only and constitute neither an offer to sell nor a solicitation of an offer to buy securities. These materials also do not constitute investment, legal or tax advice. Opinions expressed herein are those of TIFF and are not a recommendation to buy or sell any securities. 

These materials may contain forward-looking statements relating to future events. In some cases, you can identify forward-looking statements by terminology such as may, will, should, expect, plan, intend, anticipate, believe, estimate, predict, potential, or continue, the negative of such terms or other comparable terminology. Although TIFF believes the expectations reflected in the forward-looking statements are reasonable, future results cannot be guaranteed. 

The referenced case study is included for illustrative purposes only, and was selected for inclusion based on objective, investment guidelines-based criteria for the purpose of describing the investment processes and analyses that TIFF uses to evaluate such investments. 

Footnotes

  1. FY25 Commonfund-NACUBO Study of Endowments, FY25 Commonfund-NBOA Study of Independent Schools.

10 Observations After a Decade in the Independent Sponsor Market

Since TIFF’s first direct investment alongside an independent sponsor in 2014, we have completed more than 60 deals with over 25 different sponsors, making TIFF one of the most active institutional capital providers in the market. Over the past decade, the market has evolved significantly, and our approach to working with independent sponsors has evolved alongside it.

When we began investing in this space, we believed independent sponsors could serve as both a great source of attractive returns on individual deals and as potential long-term partners for fund commitments. We viewed this work as an extension of TIFF’s longstanding history in the lower middle market and our commitment to partnering with emerging managers. Expanding our direct investments into the independent sponsor arena offered a firsthand view of compelling lower middle market opportunities (which we generally define as companies with less than $100M in revenue or $25M in EBITDA), while allowing us to build relationships with high-potential managers well before they raised their first fund.

Our aim was to create a virtuous cycle around our sponsor diligence and deal diligence, leveraging our deep experience in fund underwriting to identify and assess exceptional independent sponsors while also relying on our direct investment experience to underwrite transactions alongside them. By examining both the sponsor and deal, we expected to improve our insights into each opportunity.

We believed the thesis was sound, but we did not know how it would play out in practice. More than a decade later, we can safely say the strategy has exceeded our expectations, resulting in meaningful partnerships with independent sponsors and access to compelling investment opportunities. Importantly, we have had a front row seat for the development of the independent sponsor market itself. With more than ten years of experience, we reflect on what has changed, what has remained consistent, and what we have learned.

Observation 1: The independent sponsor market has exploded in scale

The number of new PE firms continues to expand, many of which begin as independent sponsors. While no consistent data set exists on the number of independent sponsors in the market or the number of traditional PE firms that began as independent sponsors, the expansion is evident in deal activity, market events, TIFF’s own CRM, and even our inboxes. A decade ago, encountering an independent sponsor was relatively rare; today, the universe has grown, encompassing a wide range of independent sponsor types and profiles. The ecosystem of lawyers, lenders, intermediaries, and investors catering to these sponsors has expanded as well, highlighting the market’s maturation.

Observation 2: The independent sponsor deal model is gaining acceptance

While the independent sponsor model has existed in various forms for decades, its success over the past several years, both in terms of deal-by-deal returns and in serving as a pathway to raising a committed fund, has attracted more seasoned investors who have left established PE firms to launch their own independent platforms. This shift has raised the overall quality of professionals in a market that was previously populated largely by younger investors without an attributable track record, ex-bankers or consultants seeking to transition into investing, or operators pursuing deals in their niche areas of focus.

Observation 3: Capital structures and economic terms continue to evolve

Similar to the broader private equity universe, terms in the independent sponsor market continue to balance manager and investor interests. In our view, terms for independent sponsor deals are more clearly structured to align interests between investors and sponsors. Monitoring fees based on EBITDA and tiered carry structures, now relatively standard across deals we see in the market, create stronger incentives for equity value creation compared to most private equity investments. Rather than charging a flat fee and significant carried interest for minimum performance, independent sponsors must grow EBITDA and return high multiples of money to generate significant wealth. On occasion, we see an independent sponsor try to negotiate for a “premium carry” tier of 25%, but these negotiations are typically not successful and would only apply in truly outsized returns scenarios.

In an attempt to bridge the gap between an one-off deals and fully-fledged funds, we have seen pledge fund-like structures grow in popularity. These structures involve an investor and manager agreeing to certain terms and investment amounts in advance of any specific transaction. They typically include a small management fee, with the investor retaining the option to decline any individual deal. These structures can blur the line between deal-by-deal investing and traditional fund commitments in troublesome ways, providing neither the capital certainty of a fund nor the deal-specific alignment of typical independent sponsor deal.

Observation 4: The lower middle market remains an attractive and under-capitalized space

Given typical deal sizes and the ability to add value through improved strategy and operations, most independent sponsors play in the lower middle market. Yet, this segment represents only a fraction of overall U.S. deal volume. According to PitchBook data on the U.S. PE market, deals valued less than $100M have consistently accounted for between 11% and 13% of total transaction volume from 2015 through 2024. Deals valued at less than $25M, which is consistent with the range targeted by independent sponsors, have consistently represented between 2% and 3% of total deal volume since 2015.1 Despite growth in the independent sponsor market, this segment still represents a relatively small part of the broader PE market. This relative scarcity reinforces the opportunity: fewer competitors, lower entry valuations, and greater inefficiency create fertile ground for differentiated sponsors.

Share of US PE Deal Value by Size - As of Q3 2025
Source: Pitchbook as of Q3 2025.

Observation 5: Attractive valuations continue to create compelling entry points

Despite the rapid growth in the independent sponsor market and rising interest in the lower middle market by private equity, deal valuations are still well below market medians. According to the McGuireWoods Independent Sponsor Survey in 2024, 54% of independent sponsor deals were completed at EV/EBITDA valuations less than 6.0x.2 For TIFF’s own direct deals, we have averaged between 5.7x and 8.4x EV/EBITDA acquisition multiples since 2018.3 Comparatively, median private equity multiples in both the middle-market and large-cap segments are dramatically higher. Middle-market multiples have stayed between 10.2x and 14.9x while large-cap multiples have stayed between 11.1x and 13.3x.4 One would expect smaller companies to trade at lower valuations, but these independent sponsor deals are still priced well below median market multiples in larger market segments.

Entry EV_EBITDA Multiples - Through YE 2024
Source: Internal TIFF Data, Pitchbook book data; Middle-Market are deals valued between $25B-$1B in EV; Large cap is over $5B in EV.

Observation 6: Institutional investors are still largely absent

While the market has grown and more institutional investors recognize the return potential in the lower middle market, many still remain on the sidelines when it comes to investing with independent sponsors. There is limited historical data on market participation by investor type, but across deals from 2021 through 2024, only 5% of lead investors were institutional investors. Most deals were led by family offices, mezzanine or equity funds, or other private equity funds.5 In Citrin Cooperman’s 2024 Independent Sponsor Report, only 11% of capital for independent sponsor deals came from institutional investors.6 Despite the broader expansion into private equity by institutions, they have yet to enter the independent sponsor market in a meaningful way.

Lead Investor Type, McGuireWoods - Independent Sponsor Survey 2024
Source: McGuireWoods, 2024 Deal Survey of Independent Sponsor-Led Transactions, accessed October 2025.

Why have institutions mostly avoided this segment so far? Institutions are not monolithic, but several likely reasons are at play. The average investment size for independent sponsor deals is generally quite small for most large institutions (close to 50% of independent sponsor deals have a total enterprise value of less than $25M).7 Investment teams at these institutions are also rarely staffed to evaluate direct opportunities quickly and effectively. Additionally, institutional risk appetite tends to be relatively low, with a preference for more “traditional” investment structures even at the expense of higher returning opportunities. As a result, the independent sponsor market has remained the domain of more adaptable investors who have team structures in place that are better suited to take advantage of the market’s distinct dynamics.

Observation 7: Access to follow-on capital can make or break deals

Regardless of the plan at the outset of an investment, something will likely deviate from plan. Growth may not materialize as expected, macro conditions could worsen, interest rates may fluctuate, key team members could leave, etc. It is common for investments to require more capital than originally anticipated. This is particularly true for minority growth equity investments in businesses that are cash-flow neutral to slightly negative. Even if the sponsor puts cash on the balance sheet at close and expects the business to be cash flow positive going forward, one small operational hiccup can quickly lead the company to require additional capital.

For investments made from a fund, a larger pool of capital is available at the sponsor’s discretion to support the initial investment and to provide growth or rescue capital as needed. For independent sponsors, having experienced investors around the table is critical for navigating any potential headwinds or additional cash needs. Consistent and committed investors who understand the dynamics of lower middle market company performance, and who can over-equitize businesses at the outset or provide follow-on capital when appropriate, can dramatically improve the odds of successful investment outcomes.

Observation 8: Portfolio construction is essential to long-term success

Investing in independent sponsor deals requires consistency and discipline to build a strong portfolio. The risk profile of companies in the lower middle market, combined with the risks of investing with less proven or less experienced managers, requires a portfolio approach to achieve strong long-term returns. The range of return outcomes for any single deal can be wide, so diversification across managers, companies, sectors, and deal profiles can help mitigate some of the risks inherent to this market while maximizing the opportunity to achieve superior returns over a multi-year investment horizon. A portfolio approach also creates more opportunities for learning from deal to deal and from sponsor to sponsor. Approaching the independent sponsor market in a fleeting or haphazard manner is a recipe for disappointment.

Observation 9: Sponsor diligence is just as critical as deal diligence

The independent sponsor market blends manager selection with deal selection. When done well, investing in the market can create a virtuous cycle in which strong manager diligence builds confidence in the sponsor’s thesis, diligence, and value-add plan, while strong company diligence informs a perspective on the manager’s areas of strength and weakness. Success begins with the ability to source, evaluate, and partner with exceptional managers in the independent sponsor market. As the market has expanded, more experienced and high-potential managers are launching as independent sponsors, but more low-quality or undifferentiated managers enter the market as well. In our view, having a clear view of what defines an exceptional sponsor is essential for long-term market success.

Observation 10: Consistent success is predicated on long-term partnerships between sponsors and investors

As in any market showing promise, the independent sponsor landscape has attracted participants looking for quick wins with little focus on long-term success. Our experience, however, has demonstrated that patience in selecting the right sponsor and deal opportunity, diligence to evaluate all aspects of a transaction, and alignment of interest between investors, sponsors, and company management are all essential elements in generating strong returns over time. This approach builds trust between investors and sponsors, creating durable partnerships that span multiple deals in which all participants make vital contributions to investment success. While one-off transactional arrangements in this market may appeal to inexperienced investors, we remain focused on building and maintaining our long-term partnerships with exceptional sponsors.

Conclusion

After a decade of active participation, we see the independent sponsor market as more attractive today than when we began. The market is deeper and more professionalized, valuations remain well below mainstream PE levels, and institutional competition is still limited. This combination — depth without crowding — creates fertile ground for identifying attractive opportunities to generate outsized returns. Our focus remains unchanged: partnering with exceptional managers to back differentiated lower middle-market companies.

As TIFF enters its second decade of independent sponsor investing, our conviction has never been higher. We believe this direct deal strategy has delivered outstanding results while building meaningful partnerships with our sponsors. We will continue to build on these relationships and the insights gleaned over the past ten years to refine our process, focus our approach, and maintain the same level of diligence and rigor that has been central to this strategy since 2014.

The materials are being provided for informational purposes only and constitute neither an offer to sell nor a solicitation of an offer to buy securities. These materials also do not constitute an offer or advertisement of TIFF’s investment advisory services or investment, legal or tax advice. Opinions expressed herein are those of TIFF and are not a recommendation to buy or sell any securities.

These materials may contain forward-looking statements relating to future events. In some cases, you can identify forward-looking statements by terminology such as “may,” “will,” “should,” “expect,” “plan,” “intend,” “anticipate,” “believe,” “estimate,” “predict,” “potential,” or “continue,” the negative of such terms or other comparable terminology. Although TIFF believes the expectations reflected in the forward-looking statements are reasonable, future results cannot be guaranteed.

Footnotes

  1. PitchBook, Q3 2025 US PE Breakdown, published October 10, 2025.

  2. McGuireWoods, 2024 Deal Survey of Independent Sponsor-Led Transactions, accessed October 2025.

  3. TIFF Data on deal multiples by year for direct deals acquired on an EV/EBITDA basis.

  4. Data from PitchBook as of Q3, 2025; Large cap is defined as deals valued at over $5B.

  5. McGuireWoods, 2024 Deal Survey of Independent Sponsor-Led Transactions, accessed October 2025.

  6. Citrin Cooperman, 2024 Independent Sponsor Report, accessed October 2025.

  7. McGuireWoods, 2024 Deal Survey of Independent Sponsor-Led Transactions, accessed October 2025.

Can AI Outperform Human Investors? The Hedge Fund Perspective.

Executive Summary

  • The hedge fund industry is no stranger to AI, but recent advancements have improved the way hedge funds invest.
  • Data is a key competitive advantage for hedge funds leveraging AI. However, investors should understand how that data is sourced, processed, and interpreted.
  • Key impediments to broader AI adoption include the high cost of computing power and difficulty attracting top-tier talent.
  • Despite AI’s growing role, human judgment remains a critical component of investment decision-making.

Introduction

Leopold Aschenbrenner, a 23-year-old former OpenAI engineer and founder of the $1.5 billion hedge fund Situational Awareness, wrote recently that “Everyone is talking about AI, but few have the faintest glimmer of what is about to hit them.1

For an industry that hires some of the smartest people in the world and prides itself on innovative investment approaches, how vulnerable is the hedge fund industry to an AI invasion?

In reality, hedge funds have been incorporating forms of AI for decades. Large systematic (quantitative) funds have existed since the 1980s. Even more recent funds like Numerai, which relies on public tournaments to crowdsource quantitative trading signals, have been around for over a decade.2

Let’s explore how hedge funds are deploying AI today, along with the challenges that still exist.

Data and Delusion

Put simply, AI models take large amounts of data and aim to predict the future of market movements based on this data (Figure 1). Yet we often hear the question: “Isn’t data just data? Can’t everyone just buy the same data?”

Not so. In practice, we have found that access to proprietary, well-structured data has become one of the key differentiators in determining which hedge funds have an edge in the AI race.

Global Data Creation and Storage Has Grown 101x Since 2010
Figure 1. Global Data Creation and Storage Has Grown 101x Since 20103
Systematic funds represent some of the earliest and most prominent adopters of AI in the hedge fund industry. They utilize vast quantities of data to identify patterns and generate predictive signals. Investors often assume these funds have pristine data and can forecast with precision. In reality, many predictions are based on small tidbits of information. The process can sometimes be like trying to guess a picture of a dog when all you are given is 5 pixels. Many systematic funds operate with hit rates slightly over 50%, but small gains with enough repetition can lead to large gains. Unsurprisingly, systematic funds have invested heavily in their data capabilities in recent years.

Ben Wellington from Two Sigma highlighted this point on a recent podcast, emphasizing the importance of being present at the moment data is created to ensure proper categorization.4 In this podcast, he shared an example from the post-financial crisis era: after 2008, a major newspaper retroactively labeled articles from 2006 and 2007 as “subprime.” A researcher relying only on these labels might mistakenly conclude that the sudden rise in “subprime” mentions was a powerful predictive signal. In reality, it reflected backfill bias—a postmortem reclassification rather than a true early warning.

One area within hedge funds where data aggregation has shown its worth is in the event-driven space. Long-tenured Equity Capital Markets (ECM) funds investing in deals such as IPOs, M&A, and issuances have been able to accumulate a treasure trove of data on past transactions, which in turn helps make surprisingly accurate predictions about outcomes of future events.

For example, by identifying situations that are likely to lead to a deal break, an M&A fund could limit its exposure to left-tail events, thereby enhancing its overall return profile of the fund.

Moving forward, we believe those funds with the deepest, richest, and most proprietary data will retain a significant edge. More recent entrants will need to demonstrate more creativity in how they use available data to leapfrog incumbents.

Talent and Technology

Nvidia’s staggering ~1,200% performance5 over the past five years has demonstrated the importance of computing power to AI development. More processing power means faster hypothesis testing and portfolio optimization which may lead to faster and better signal development. For systematic funds, this could translate directly into alpha. The downside is that processing power is expensive and difficult to scale. Leasing costs for data centers for a large systematic fund can run into hundreds of millions of dollars per year, thus limiting the amount of AI a smaller hedge fund can realistically deploy.

More important than processing costs is the ability to attract talent. It is often said that 20% of researchers generate 80% of the successful signals in a given year, though the challenge is that no one knows in advance which 20%. For this reason, it is important to keep a wide cast of highly talented (and highly paid) staff on the payroll. Hedge funds are competing with technology firms for top AI talent, with pay packages now exceeding $1 million per year.  What’s more, each AI developer needs to have a supporting cast of data engineers and developers to help turn theory into reality.

That said, we have seen increasing success rate among more entrepreneurial managers who strike out on their own with assistance from AI, particularly those focused on a specific niche.

Judgement and Justification

For all of AI’s capabilities, there remain areas of investing where human judgment is difficult to replicate. Manager discretion is one of the most significant. Fundamental strategies retain an edge in situations where decision-making depends on conviction, contrarian thinking, or nuanced human interactions. For example, when a portfolio manager chooses to concentrate on a handful of high-conviction positions, or makes a contrarian trade based on direct engagement with company management, the driver is individual judgment rather than an algorithmic signal.

Management meetings underscore this distinction. Whether investors are receptively learning or seeking to influence outcomes through activism, these activities remain firmly in the fundamental toolkit, not the quantitative one. Human relationships and qualitative assessments are central to investment due diligence, and AI has not yet shown an ability to replicate these dynamics. Many of the top-performing fundamental hedge funds demonstrate a proclivity to execute judgment calls that may rest on nothing more than pattern recognition honed over years of experience in a particular market segment.

This is not to say AI cannot aid the traditional investment process. We often find that today’s fundamental investors are using AI to help them summarize information and build a baseline understanding. Tools capable of reading decades of company filings in minutes, updating financial models post earnings in seconds, and distilling real-time company news into bullet points have given these managers much greater efficiency in their decision-making.

Conclusion

We remain optimistic about AI’s potential and believe it will continue to reshape the landscape of the hedge fund industry. However, managers should be cautious not to rely so heavily on AI that they lose their judgment.

The materials are being provided for informational purposes only and constitute neither an offer to sell nor a solicitation of an offer to buy securities. These materials also do not constitute an offer or advertisement of TIFF’s investment advisory services or investment, legal or tax advice. Opinions expressed herein are those of TIFF and are not a recommendation to buy or sell any securities.

These materials may contain forward-looking statements relating to future events. In some cases, you can identify forward-looking statements by terminology such as “may,” “will,” “should,” “expect,” “plan,” “intend,” “anticipate,” “believe,” “estimate,” “predict,” “potential,” or “continue,” the negative of such terms or other comparable terminology. Although TIFF believes the expectations reflected in the forward-looking statements are reasonable, future results cannot be guaranteed.

Footnotes

  1. Leopold Aschenbrenner, Situational Awareness: The Decade Ahead, 2025. https://situational-awareness.ai/introduction

  2. Justina Lee, “JPMorgan Pledges $500 Million to Crowdsourcing Hedge Fund Numerai,” Bloomberg, April 16, 2024. https://www.bloomberg.com/news/articles/2024-04-16/jpmorgan-pledges-500-million-to-crowdsourcing-hedge-fund-numerai

  3. Blackstone, Cutting Through the Noise: The Long-Term Case for Data Centers, The Connection, 2024. https://www.blackstone.com/the-long-term-case-for-data-centers

  4. “Ben Wellington: ML for Finance, NYC Open Data, and Communicating with Maps,” The Gradient: Perspectives on AI, Apple Podcasts, January 10, 2024. https://podcasts.apple.com/us/podcast/ben-wellington-ml-for-finance-and-storytelling/id1569777340?i=1000649209968

  5. Kif Leswing, “Nvidia Hits $3 Trillion Market Cap on Back of AI Boom,” CNBC, June 5, 2024. https://www.cnbc.com/2024/06/05/nvidia-briefly-passes-3-trillion-market-cap-on-back-of-ai-boom.html

So, You Are Considering Changing Your Spend Rate

Executive Summary

  • An institution may consider changing its spend rate for various reasons, such as facing financial challenges and wanting to increase budgetary support or experiencing financial success and aiming to grow the endowment more quickly.
  • When considering a change in spend rate, it is important to understand how it affects the endowment’s future purchasing power and budgetary support.
  • Spend rates require careful balance: they cannot be so low that the institution lacks support, nor so high that maintaining inflation-adjusted principal becomes challenging, as the endowment must earn a return to offset spending plus inflation.
  • Two main trade-offs to consider when changing spend rates:
    • Timing of value: Higher spending today versus more spending dollars in the future due to asset compounding over time
    • Impact to endowment strategy: Rate changes may require adjustments to target return requirements, risk level, and asset allocation

The Decision Framework

Whether driven by financial pressures or strategic opportunity, spend rate adjustments represent one of the most significant decisions an endowment can make. The process requires careful analysis of both quantitative impacts and qualitative institutional factors. As a reminder, spend rate is the percent an institution withdraws from its endowment on an annual basis. Please refer to our Spend Policy 101 for a foundational overview.

Balancing Mission Support and Purchasing Power

At its core, spend rate decisions involve balancing competing institutional priorities. These dual endowment goals—supporting today’s mission while preserving tomorrow’s purchasing power—create a natural tension that requires careful balance. Rates too low fail to adequately support institutional needs, while rates too high make it challenging to maintain real value over time.

Key Trade-offs in Changing the Rate

Timing of the Value

A key consideration in determining if a rate change is appropriate is identifying when the institution would benefit most from its endowment funds.

For example, funds left in the endowment will grow and compound creating a larger spend in the future, while funds taken from the endowment will provide an immediate budget impact today.

Case Study

The example below highlights the trade-off in a $100M endowment of raising a 3-year trailing average spend of 4% to 4.5%. The numbered commentary corresponds to the charts that follow.

  1. There is an immediate impact on spend to support the budget, which continues for several years.
  2. However, all else being equal, this larger spend reduces the size of the endowment.
  3. At a certain point, the spend to the institution is now less at 4.5% than 4%, because the endowment size has been reduced over time.
By the Numbers: Trade-off between Increasing the Rate
Source: TIFF analysis; assumes 3-year annual trailing spend methodology and a 7% annualized return.

Factors to Consider

When having these discussions, pairing quantitative analysis with collaborative discussion is important. Here are some key factors worth considering:

  • Value of the change: Consider the net present value of the marginal budget support
    • For rate increases, determine whether they support long-term value or address one-time, short-term uses
  • Duration of spend rate change: Spend rate changes are not permanent and can be changed again in the future
  • Spend methodology: How the institution calculates the spend will impact the trade-offs
  • Endowment portfolio construction: Consider target returns, long-term expected real returns excluding spend, and risk level
  • Inflation expectations: These impact target returns as well as budget and potentially spend methodology
  • Institutional factors: Evaluate current and future funding requirements, and the organization’s broader financial situation (revenue sources and stability, debt, etc.)
  • Industry trends/perspective: Peer comparisons on both endowment and institutional factors exist to help contextualize each institution’s circumstances

Potential Impacts to the Endowment from Changing the Rate

Changing the rate can also have implications for the endowment, either providing more flexibility to grow or creating challenges to maintain principal. Most institutions maintain their investment strategy when lowering the rate, hoping to compound assets faster and build the endowment’s asset base for the future. The challenge arises when an institution increases its spend rate: can it adjust its risk or asset allocation enough to maintain the inflation-adjusted corpus?

Potential Impacts to the Endowment from Changing the Rate

Conclusion

Changing an institution’s spend rate requires careful consideration, input from a multitude of stakeholders, and thorough analysis of both qualitative and quantitative trade-offs. It is not a decision to be made without robust dialogue with key constituents. If your institution is considering a change to your spend rate, TIFF is ready to help navigate the various considerations and determine the right path for your institution.

Past performance is no guarantee of future results and the opinions presented cannot be viewed as an indicator of future performance. There is no guarantee that any particular asset allocation or mix of strategies will meet your investment objectives.

The materials are being provided for informational purposes only and constitute neither an offer to sell nor a solicitation of an offer to buy securities. These materials also do not constitute investment, legal or tax advice. Opinions expressed herein are those of TIFF and are not a recommendation to buy or sell any securities.

These materials may contain forward-looking statements relating to future events. In some cases, you can identify forward-looking statements by terminology such as “may,” “will,” “should,” “expect,” “plan,” “intend,” “anticipate,” “believe,” “estimate,” “predict,” “potential,” or “continue,” the negative of such terms or other comparable terminology. Although TIFF believes the expectations reflected in the forward-looking statements are reasonable, future results cannot be guaranteed.

Underweighting Equities is Usually a Bad Idea

Executive Summary

  • Investors considering timing equities should proceed with caution
  • Forecasting returns, particularly over short-time horizons, is very difficult
  • Underweighting equities often results in unattractive opportunity costs
  • Successfully timing the decision to return to a normal long-term allocation requires extreme fortitude

The past few months have been a period of very high volatility in equities due to several factors. Items weighing on investors likely include a combination of President Trump’s decision to increase tariffs on imports, continued tensions between the US and China, unclear resolutions to the armed conflicts in Gaza and Ukraine, and uncertainty from the DOGE initiative, which could either help balance the budget resulting in a more efficient US government or weaken a variety of strategically important social services and government programs. We have started to receive some questions from clients about the merits of underweighting equities relative to their long-term strategic targets. In general, we do not recommend that course of action for several reasons:

1. Forecasting Challenges

It would add material value if we could avoid the very worst months or quarters in equities. Unfortunately, forecasting in investments is unlike forecasting in most other fields. Predicting outcomes over the next month or year is not that difficult in most industries. Most owners and operators of businesses have a good idea of how their company will perform over the next month or quarter. However, forecasting business outcomes over the next ten years is much more difficult, if not impossible, for most sectors. For example, many publicly traded companies provide guidance for the next year but very few provide detailed guidance beyond that. Forecasting in investments is exactly the opposite. The range of annualized returns for monthly or quarterly data points is very wide. If we instead looked at rolling five-year outcomes and annualized those results, the range of IRRs would be considerably tighter. In investments, the longer the time horizon becomes, the easier it is to accurately predict the rate of return. The table below illustrates that shorter periods show a wider range of outcomes, with a 72% spread between the best and worst months. In contrast, longer periods, like five years, have a much narrower range, with approximately a 10% spread.

Range of Annualized Returns at Different Measurement Intervals, 1945-20241

Annualized Returns by Measurement Interval

We observe the challenges in short-term forecasting when evaluating managers. One of the methods we use to evaluate equity long/short hedge funds is to decompose the sources of excess returns into three categories: longs, shorts, and value-added from variance in net exposure. Across a growing library of several hundred different managers, we have seen very little evidence of statistically significant value-added from short-term variance in the net by equity-oriented hedge fund managers. We utilize a similar strategy for long-only managers who prefer to hold cash. It is very rare for the managers’ actual realized results to outperform a pro forma portfolio that grosses up their holdings such that they would have been at least 95% fully invested at all times. Even among trend-following managers, who are much more focused on market timing, we have seen mixed results. Short-term forecasting is very difficult.

2. Opportunity Costs

If we instead rely on longer-term forecasts, which are typically more accurate, we encounter a different problem. For an institutional portfolio, the meter is always running. We do not get to call capital when interesting opportunities arise and give it back when there are less attractive options. When we reduce equities, the capital must go somewhere else. The most obvious alternative to stocks when people are concerned about the risk of losing money is bonds or cash. The problem we face as investors is there are not many periods when bonds or cash outperform stocks over reasonable forecast horizons. We have used the S&P 500 and the benchmark 10-year Treasury bond for our analysis below.

Average Relative Results: Stocks vs. Bonds2

Stocks v Bonds

Even if the next five or ten years will in fact turn out to be one of these unusual periods when the return on equity is disappointing, it is important to evaluate the alternative use of capital. Revisiting the first chart and assuming the next five years will generally be a bottom-quartile return period for stocks, we can roughly estimate a 5% annualized return. The problem is that the yield to maturity on the 10-year Treasury bond is only 4.2%3. Selling something with an estimated return of roughly 5% to buy something that we should reasonably expect to return 4% is still a long-term expected performance concession. As outlined in Jay Willoughby’s Q4 2024 CIO Commentary and given some of the fiscal challenges the US faces, we think a much higher starting yield to maturity on bonds would be required for investors to consider materially underweighting equities in favor of bonds.

3. Psychology and the Pattern of Returns

For an equity market timing strategy to be successful, investors need to get two calls correct, not one. Those who underweight their long-term strategic targets will eventually need to decide when to return the equity allocation to its normal level. This second decision is key because, in equities, the big days are very important. Since 1945, the annualized return on the S&P 500 is roughly 7.9%4. If we exclude the top 1% return days, the annualized return would be a loss of -1.8%. Market prices tend to overshoot the changes to long-term fundamentals. As a result, equities are often undervalued at the bottoms of drawdowns. Also, markets discount anticipated economic conditions. When sentiment finally improves at the bottom of a drawdown, prices can move back up very quickly. The tables below show the best single day returns for the S&P 500 since 1945. All of them occurred during points in the cycle when uncertainty and volatility were very high. Because the absolute best days and worst days tend to cluster together, mistiming one of the two decisions, even by a day, can be very damaging. The best time to add to equities will often be at the point in the cycle in which doing so feels the most uncomfortable. The average investor who tries to time the market is highly likely to miss at least the first part of the recovery. Missing these big days often locks in long-term underperformance.

Highest Single Day Returns for the S&P 500, 1945 – 20245

Highest Single Day Returns from the S&P 500

Conclusion

While equity market volatility can be unsettling, maintaining a long-term perspective on equities is crucial for achieving optimal investment outcomes. Predicting short-term market movements is highly challenging, and the costs of missing key recovery days can be significant. By sticking to a long-term strategy around equities, investors can avoid market-timing pitfalls and benefit from the growth potential of owning stocks. Our tactical adjustments to equity exposure tend to be small because we understand how difficult it is to do this well. We tend to be biased to overweights because that improves our odds of generating good returns.

The materials are being provided for informational purposes only and constitute neither an offer to sell nor a solicitation of an offer to buy securities. These materials also do not constitute an offer or advertisement of TIFF’s investment advisory services or investment, legal or tax advice. Opinions expressed herein are those of TIFF and are not a recommendation to buy or sell any securities.

These materials may contain forward-looking statements relating to future events. In some cases, you can identify forward-looking statements by terminology such as “may,” “will,” “should,” “expect,” “plan,” “intend,” “anticipate,” “believe,” “estimate,” “predict,” “potential,” or “continue,” the negative of such terms or other comparable terminology. Although TIFF believes the expectations reflected in the forward-looking statements are reasonable, future results cannot be guaranteed.

Footnotes

  1. Source: Bloomberg.

  2. Source: Bloomberg and Federal Reserve.

  3. Bloomberg as of 4/30/25.

  4. Equity price data sourced from Bloomberg.

  5. Source: Bloomberg.