The NACUBO-Commonfund Study of Endowments FY25 average one-year performance for all institutions is 10.9%, bringing the 10-year average return to 7.7%. TIFF’s November 2025 preliminary FY25 outlook reflects a similar view to the final NACUBO report’s findings on performance.
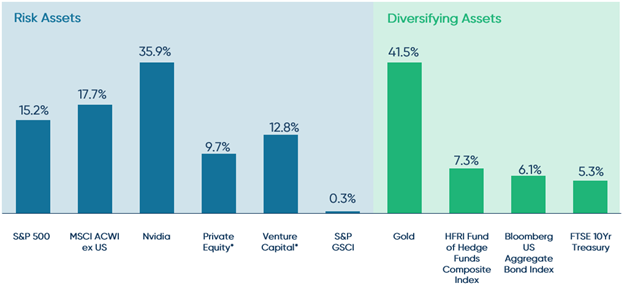
Everyone’s a winner in 2025: There were many ways to win in FY25, as no single asset class was an outlier in performance, in contrast with prior years. No major asset class had negative returns and the bottom 10% of endowments still returning 8.4%. Those who eked out top quartile performance likely had overweight allocations to AI themes (public or private), precious metals (e.g., gold), international equities and hedge funds.
Size didn’t matter for the first time in a long time: FY25 performance was relatively even across size-based cohorts. With strong performance across a variety of asset classes, the asset allocation differences across size segments didn’t materialize in meaningfully different performances. While the $5B+ peer group had the highest average FY25 returns at 11.8%, the second-highest returning peer group was the $51M-$100M group with an average return of 11.1%. Historically, endowment size has been a strong determinant of performance, with larger endowments historically outperforming smaller endowments due to larger allocations to private assets. We saw this reverse the past two years (FY23-24), when smaller endowments outperformed their larger counterparts.
Narrow band of outcomes: Due to strong performance across all asset classes, there was not as much dispersion in investment outcomes compared to previous years. The interquartile dispersion, which measures the gap between the 75th and 25th percentiles, was 2.4% in FY25. This is low compared to the previous five fiscal years, which saw interquartile dispersion ranging from 3.1% to 7.1%.
Operating budgets lean more on endowments: Institutions appear to be increasing use of the endowment to support their mission. In FY25, the average portion of the operating budgets funded from endowments reached 15.2%, compared to 14.0% in FY24 and 10.9% in FY23. While spend rates have remained relatively stable, special appropriations have increased in recent years, particularly for larger endowments. In FY25, the majority of specially appropriated funds went towards the operating budget.
Strong returns, persistent headwinds: Despite a positive endowment performance year, higher education faces a myriad of headwinds that are putting pressure on institutions to lean on their endowments. Pressures come from both sides: revenue (declining enrollment, gifts and federal funding) and costs (higher inflation, increased endowment tax). However, different size segments face different pressures. For smaller endowed institutions, enrollment tops the list of concerns, while they also face challenges in fundraising and increasing financial aid. For the largest endowed institutions, the predominant concerns are federal funding cuts and liquidity.
FY25 Asset Class Returns
*As reported State Street Investment Management. Source: State Street.
The materials are being provided for informational purposes only and constitute neither an offer to sell nor a solicitation of an offer to buy securities. These materials also do not constitute an offer or advertisement of TIFF’s investment advisory services or investment, legal or tax advice. Opinions expressed herein are those of TIFF and are not a recommendation to buy or sell any securities.
These materials may contain forward-looking statements relating to future events. In some cases, you can identify forward-looking statements by terminology such as “may,” “will,” “should,” “expect,” “plan,” “intend,” “anticipate,” “believe,” “estimate,” “predict,” “potential,” or “continue,” the negative of such terms or other comparable terminology. Although TIFF believes the expectations reflected in the forward-looking statements are reasonable, future results cannot be guaranteed.
Princeton announced it was lowering its endowment expected return from 10.2% to 8%.
The main reason cited was a slow, decades-long declining return profile, in part due to changing fundamentals of illiquid asset classes (e.g., private equity).
The impact is reduced future budget support from the endowment, moving Princeton from a decade of strategic growth to a posture of “focus,” “efficiency,” and “substitution rather than addition.”
This message of budget constraint comes at a time when multiple headwinds are putting pressure on higher education finances. 2025 saw federal university research funding come under attack, along with an endowment tax increase. This is on the heels of multiple years of above-average inflation.
Is this a big deal? It feels very dramatic! For Princeton, this is a meaningful change and a very real problem that endowed nonprofits face. Princeton’s budget is highly sensitive to changes in the endowment value, as 65% of the budget comes from the annual endowment draw.
How did Princeton get here? Over the last 25 years, Princeton has made various strategic choices to increase the amount taken from the endowment (i.e., by increasing the spend rate) and used within the budget, which in turn increased Princeton’s budget allocation from the endowment. These choices have been underpinned by an above-average expected endowment return of 10%, which Princeton maintained until this letter.
Strategic considerations for endowment institutions:
Acknowledge and understand your endowment dependence
Understand the spend rate trade-off
Periodically assess if one’s portfolio aligns with one’s needs
TIFF has been helping endowed nonprofits navigate these strategic endowment-related topics for 35 years.
From Growth to Focus: Why the Endowment Matters
In Princeton University’s President’s Annual Letter1, President Christopher L. Eisgruber delivered a sober message that Princeton would be moving from a decade of strategic growth to a posture of “focus,” “efficiency,” and “substitution rather than addition.” Underlying this change in tone was a dramatic reduction in Princeton’s endowment expected return, dropping from 10.2% to 8.0%. The stated reason was “changing market fundamentals” in the investment landscape, particularly in illiquid asset classes (e.g., private equity), which faces more competition today than when Princeton began investing in the 1980s. With 65% of Princeton’s budget coming from the endowment, a reduction in expected return means there will be less available capital to flow into the budget in the future. This belt tightening message also comes at a time when higher education is facing a multitude of headwinds, such as shifting federal funding policies, increased endowment tax (for some institutions), and heightened inflation.
The challenge Princeton faces today is an issue all endowed nonprofits face on a regular basis: how to balance maintaining real purchasing power in the endowment while supporting the institution’s mission. However, Princeton has been in a privileged position for decades, with its above-average endowment returns, sustained growth, and ultimately support for the university’s budget.
TIFF took a deeper look at Princeton and what endowed nonprofits can learn from their situation.
Major Contributing Factors to this Predicament
There are three contributing factors related to Princeton’s budget that warranted a letter. All of these factors are interwoven. When the endowment returns are high, the endowment can support an expanding budget while also growing the endowment’s value. However, when expected returns fall, something must adjust–if the spend rate remains the same, the endowment will start to lose purchasing power. At the same time, when such a large percentage of the budget comes from the endowment, any reduction is felt widely.
High endowment dependency / high sensitivity to changes in endowment value: At 65% endowment reliance, Princeton has the highest dependency in the Ivy League2, and far above similarly-sized peer average of 18.3%.3 While this is a privilege to have freedom from external revenue sources (e.g., tuition), it also makes Princeton’s budget highly sensitive to changes in endowment value.
High spend rate: The FY25 spend rate was 5.37%, compared to an average peer spend rate of 5.0%.4
High required expected return: Princeton has maintained an expected return of 10% or higher, compared to the peer average target return of 8.1%.5
25 Years of Strategic Choices Led Princeton Here
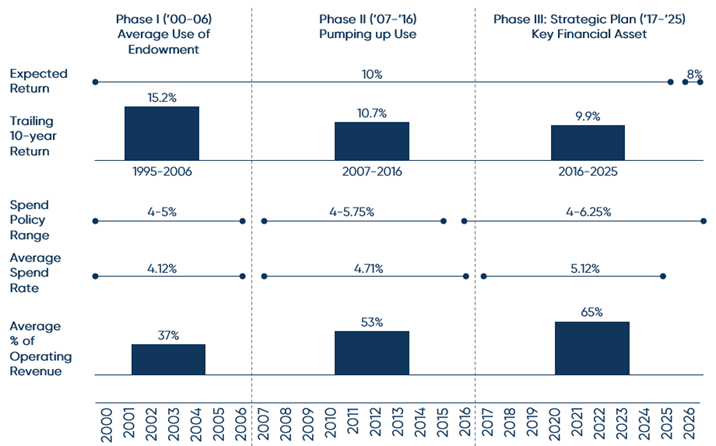
When reading 25 years of Princeton’s annual Report of the Treasurer, it is clear Princeton made strategic decisions to increase the amount taken from the endowment to increase budget support. In the following graphic, I break down 25 years of history into three broad phases. At the end of each phase, Princeton made policy decisions to increase the use of the endowment, which in turn increased the average spend rate and the percentage of operating revenue from the endowment.
Graphic: Summary of Key Princeton Endowment & Budget Related Metrics Over Time
Source: Princeton University Report of the Treasurer FY 2000-2025; Spend rate 2000-2007 based on Primary Pool distribution rate.
Increased the spend rate policy range by +1.25%, paving the way for larger draws: Princeton voted twice to increase the upper bound of this range, once in 2006 to 5.75% and again in 2015 to 6.25%, with the stated goal of supporting a higher spend rate. In announcing the 2015 increase to 6.25%, Princeton noted that “the Trustees decided that, considering the continued strength of Princeton’s investment program, higher long-term average spending rates could be supported and, indeed, that a higher average rate of spending was needed in order to achieve intergenerational equity, i.e., having endowment spending patterns that balanced the interests of current and future students and faculty.6” Princeton follows a spending policy where the Trustees annually approve a percentage to be taken from the endowment, based on the most recent fiscal year-end value.
Increased endowment draw post-2006: The following 10 years after the first policy change, the average spend rate increased by 14.3%, from 4.1% to 4.7%.
Implemented ambitious strategic plan 2017-2025, pulling more from the endowment: In 2016, Princeton announced an ambitious plan to expand the campus and university offerings.7 It noted at the start of this plan that the university would purposefully draw more from the endowment to support this vision. During this eight year period, the average spend rate increased to 5.12%, up by 8.4% from the prior 10-year average of 4.71%. In addition, during this period, endowment dependency increased in a step-wise fashion. The operating revenue from the endowment for FY14-FY16 was 55%. In the first year of the strategic plan (FY17), endowment support rose to 61% and increased again in FY18 to 65%, where it has generally remained.
Increased endowment dependency by 89%: Over the past 25 years, Princeton’s operating revenue from the endowment increased from 34% in 2000 to 65% in 2025. Each policy increase resulted in a step change in endowment dependency. This has afforded Princeton the ability to implement many of its offerings, such as financial aid packages. However, it also means Princeton has fewer levers to pull in terms of other revenue sources if the endowment doesn’t provide what is expected.
Maintaining of 10% expected return for 25 years: Underpinning all of this financial support is the endowment’s performance and growth. For 25 years, Princeton has maintained its 10% expected return, until 2026. What strikes TIFF as somewhat odd is this consistency. Much has changed in 25 years across all asset classes, and maintaining the same expected return for that length of time is unusual. Perhaps we give Princeton the benefit of the doubt that internally PRINCO had its own varying expectations, and only externally was the 10% noted. However, it is clear that 10% is a key underlying assumption to this endowment-budget relationship, and that assumption did not change.
Three Takeaways from Princeton
Acknowledge and understand your endowment dependence: An endowment of any size is a gift for a nonprofit, helping to provide financial resiliency and flexibility. However, when dependence on the endowment in one’s budget starts to become significant, it means one’s institution becomes more sensitive to endowment changes. The cushion from diversification of revenue sources decreases as the endowment dependence increases. Having a clear understanding of this dynamic on one’s budget is important.
Understand the spend rate trade-off: Choosing how much to draw from one’s endowment remains an age-old push and pull between supporting institutional needs today while maintaining purchasing power after inflation. For more details on this trade-off, please refer to TIFF’s piece on how to think about changing of one’s spend rate here.
Periodically assess if one’s portfolio aligns with needs: Underneath the spend rate and budgetary endowment dependence is the investment portfolio and expected return assumptions. Ensuring that all three of these elements work together in harmony is key to long-term financial health of both the endowment and the institution.
Princeton’s announcement is not just about one university lowering a return assumption. It is a reminder that endowment dependence, spending policy, and institutional specific characteristics must remain aligned, especially in an ever evolving investment landscape. Institutions that proactively revisit these assumptions are better positioned to sustain their missions over the long term.
For 35 years, TIFF has helped endowed nonprofits achieve their investment goals to support their missions. Our work around setting a Strategic Asset Allocation remains grounded in the key issues raised by Princeton’s letter: a portfolio designed to achieve appropriate target returns that support institutional financial needs. As institutions face these questions, TIFF works to help guide the conversation to the answer right for their organization.
The materials are being provided for informational purposes only and constitute neither an offer to sell nor a solicitation of an offer to buy securities. These materials also do not constitute an offer or advertisement of TIFF’s investment advisory services or investment, legal or tax advice. Opinions expressed herein are those of TIFF and are not a recommendation to buy or sell any securities.
These materials may contain forward-looking statements relating to future events. In some cases, you can identify forward-looking statements by terminology such as “may,” “will,” “should,” “expect,” “plan,” “intend,” “anticipate,” “believe,” “estimate,” “predict,” “potential,” or “continue,” the negative of such terms or other comparable terminology. Although TIFF believes the expectations reflected in the forward-looking statements are reasonable, future results cannot be guaranteed.
AI allows our investment process to be deeper, faster, and more consistent.
Our team can shift resources away from mechanical tasks and toward higher-value analytical and judgement-driven work, aiming to improve our qualitative research, meeting preparation, thematic analysis, and performance attribution.
While we are adding these capabilities into existing workflows iteratively, decisions still require meaningful human judgement, interpretation, and oversight.
Next steps include exploring the use of AI for forecasting manager outcomes.
How AI Enhances our Investment Process
Over the past two years TIFF has integrated AI into our investment process, and it has already proven to be a worthwhile investment. At a high level, AI enables us to move faster without cutting corners, analyze more information without losing rigor, and apply a more consistent analytical framework across managers, strategies, and time periods. The result is a deeper, more scalable research process that supports better-informed decisions.
More Structured and Auditable Qualitative Analysis
One of AI’s most powerful contributions has been transforming how we handle qualitative information. Investment research is inherently text-heavy, encompassing manager letters, pitch decks, due diligence questionnaires, meeting notes, and internal memos. Historically, synthesizing this information has been time-consuming.
Dynamic Summary of a Manager’s Entire Investment History with TIFF: Prior to implementing our AI system, an analyst seeking to understand the investment thesis for a manager would have needed to navigate our research management system, locate the investment memo, review subsequent update notes, synthesize the information, and then form a view—a process that could take hours. Today, we can query a large language model that has already incorporated our entire research library to summarize a manager’s investment history with TIFF in under a minute. Importantly, all outputs are fully auditable and directly tied to source underlying documents.
Ingestion of Incoming Manager Information: AI also allows us to systematically ingest, structure, and analyze incoming text through a process as simple as forwarding an email. Previously, tagging, uploading, and filing materials required significant manual effort. Now, we use built-in tools that automatically detect, summarize, and email quarterly letter summaries to the investment team.
Consistent and Robust Manager Comparison Matrix: A particularly valuable capability is matrix-style analysis, which allows us to compare and contrast managers using multiple documents or time horizons. This approach enables us to identify common themes, points of divergence, recurring risks, and key differentiators far more quickly than traditional manual review. For example, we can construct a matrix that queries the most recent quarterly letters from all public markets managers and then directly interact with the results to understand areas of agreement and disagreement across our portfolio. What once required a week of effort can now be accomplished in under an hour, freeing time for deeper interpretation and discussion.
Consistent “First-Pass” Review for New Managers: When evaluating new managers, we use a matrix to compare each underwriting criterion at the sub-strategy level (e.g., applying our pre-defined manager-ranking criteria, conducting a scoring exercise, and supporting an answer in less than 100 words). Where AI’s perspective differs from our own, it suggests areas for further investigation—augmenting, rather than replacing, human judgment.1
Improved and Consistent Meeting Preparation
AI has also become central to how we prepare for manager meetings. Using structured, in-depth research workflows, we now produce concise overviews of a manager’s strategy, history, public reputation, strengths, weaknesses, and potential areas of concern prior to both initial and follow-up meetings. Importantly, AI also helps identify gaps, inconsistencies, or areas where information is sparse—often among the more productive areas to explore in conversation. Where risks or uncertainties warrant external validation, we use AI to help structure diligence plans, including suggested data requests and lines of inquiry for in-person meetings.2
Faster, More Targeted, and Deeper Thematic and Industry Research
AI materially improves our ability to capitalize on new strategies, industries, and market themes. When exploring unfamiliar areas, speed matters—but so does breadth. AI allows us to quickly synthesize large bodies of third-party research, expert commentary, and historical context to build a foundational understanding before engaging in deeper primary diligence.
This capability is particularly valuable in early-stage thematic work, where the goal is not precision forecasting, but rather understanding the landscape: how a strategy works, what risks tend to matter, where returns come from, and how different approaches compare.3
Clearer Performance Attribution and Risk Understanding
On the quantitative side, AI-enhanced tools improve how we analyze portfolio performance and risk exposures. Traditional multi-factor regressions remain useful, but machine learning techniques allow us to go further by identifying which factors truly matter statistically and offer better ways of isolating idiosyncratic returns (skill) from systematic returns. For example, we use techniques such as lasso regressions to determine which among the dozens of equity style factors are most closely related to a manager’s results. This leads to clearer attribution and more informative conversations about portfolio construction, diversification, and risk management.4
Next Step, Forecasting
While our systematic managers are using AI methods to directly forecast asset prices, TIFF is not currently using AI methods to forecast manager-level outcomes. Over the next year, we aim to examine this area further, as we believe that layering our unstructured text data with our structured numerical data could enhance our forecasting capabilities and support better decision-making.
Conclusion
AI is enhancing TIFF’s investment process by enabling a deeper, faster, and more consistent approach to research while reinforcing the central role of human judgment. By shifting time away from mechanical tasks and toward thinking, discussion, and decision-making, AI helps our team operate more productively. Assessing incentives, motivation, alignment, strategy coherence, portfolio fit and sizing remain fundamentally human responsibilities. AI simply allows us to bring more informed data, improved consistency, and a broader perspective to those judgments. As AI technology capabilities continue to level up, we see opportunities to further strengthen our research process.
The materials are being provided for informational purposes only and constitute neither an offer to sell nor a solicitation of an offer to buy securities. These materials also do not constitute an offer or advertisement of TIFF’s investment advisory services or investment, legal or tax advice. Opinions expressed herein are those of TIFF and are not a recommendation to buy or sell any securities.
There can be no guarantee that the use of Artificial Intelligence (“AI”) and Large Language Models (“LLMs”) will lead to investor returns. AI tools and LLMs may contain errors or inaccuracies and should not be relied upon as a substitute for professional advice. Any references to AI tools and LLMs use and advantages should be construed accordingly.
These materials may contain forward-looking statements relating to future events. In some cases, you can identify forward-looking statements by terminology such as “may,” “will,” “should,” “expect,” “plan,” “intend,” “anticipate,” “believe,” “estimate,” “predict,” “potential,” or “continue,” the negative of such terms or other comparable terminology. Although TIFF believes the expectations reflected in the forward-looking statements are reasonable, future results cannot be guaranteed.
Footnotes
These capabilities are enabled primarily through our research management platform, Finpilot AI.
ChatGPT Enterprise is the primary tool supporting this workflow.
We also utilize external research libraries with AI overlays, such as AlphaSense.
These capabilities are supported through Two Sigma Venn.
Total Portfolio Approach (TPA) has become a focal point of portfolio construction discussions, as large institutional investors have recently adopted it.
TPA advocates for a portfolio to be managed as a whole, setting a portfolio-level risk budget and allocating across the best ideas within any asset classes.
This contrasts with a traditional Strategic Asset Allocation approach, which sets asset-class targets based on long-term return expectations and allocates within each asset class to achieve the target.
While TPA has become the new darling of portfolio construction discussions, TIFF believes that TPA’s core tenets are just best practices of a robust investment program. Those tenets include the use of clear objectives and the incorporation of multiple risk factors in one’s allocation assessment.
There are practical limitations of implementing TPA, too, such as the increased reliance on factor modeling, the flexibility (or inflexibility) of illiquid positions, and the need to shift decision-making towards the CIO.
TIFF believes its investment process incorporates the best elements of both SAA and TPA: allocating capital based on clear objectives and the best marginal idea to the portfolio, grounded on today’s best information, with a long-term eye towards expected returns.
Where does TIFF stand on The Total Portfolio Approach?
There are always new and evolving ideas on portfolio construction theory. While Total Portfolio Approach (TPA) has been around for decades, it has been gaining increased exposure in the U.S., particularly since the California Public Employees’ Retirement System (CalPERS) — a pension fund behemoth controlling $600+ billion1 in assets — announced it will be implementing TPA effective July 1, 2026. Several high-profile, international mega-institutions, including Canada’s Pension Plan Investment Board, Singapore’s GIC, and Australia’s Future Fund, have espoused TPA as a more modern, flexible, and risk-aware way to manage complex portfolios than Strategic Asset Allocation (SAA).
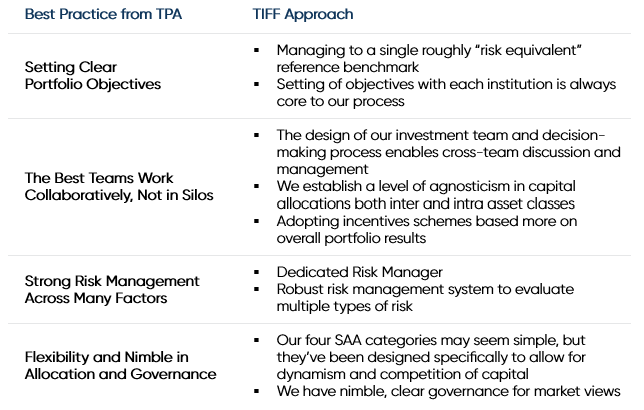
However, many of the core beliefs of TPA are familiar to CIOs and capital allocators. TIFF believes that TPA’s core tenets are simply best practices of a robust investment program. At the same time, there are certain practical limitations of implementing TPA (and eliminating any SAA elements). In the process of examining the real-world pros and cons of TPA, TIFF discovered our program is already implementing the best elements of TPA, while maintaining a long-term eye on capital allocation through the SAA framework.
What is the Total Portfolio Approach?
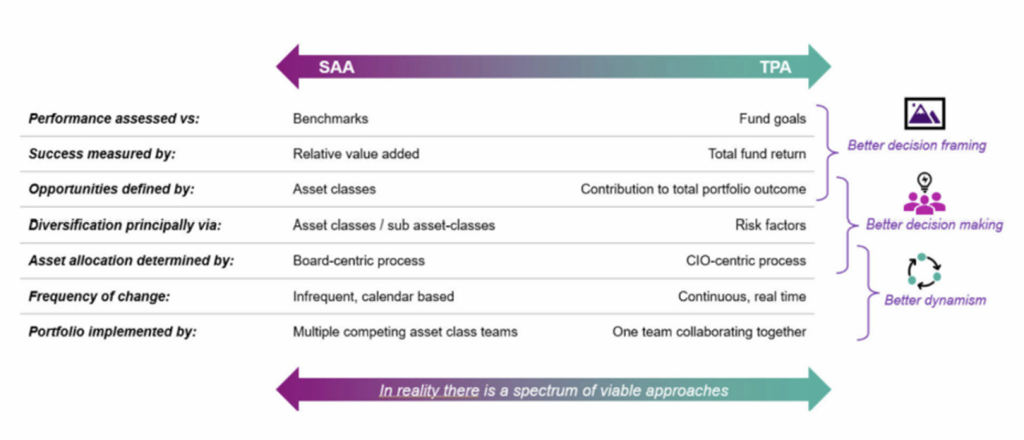
TPA advocates for managing a portfolio as a single, integrated whole, rather than as a collection of independent asset-class sleeves. It reframes the allocation process so that capital and risk are allocated simultaneously against total portfolio objectives, or a single reference portfolio benchmark.
In practice, this often includes:
Portfolio Objective & Risk Budget: Setting total portfolio objectives and a single portfolio reference benchmark (e.g., 65/35 MSCI ACWI/Bloomberg Aggregate).
Unified Risk Management: Managing risk across the entire portfolio, using a single risk budget and considering various risk types (drawdown, liquidity, etc.) holistically.
Factor-Based Investing: Focusing on broad economic factors (like inflation, geopolitics, climate) and their impact on returns, allowing for better positioning against future shocks, instead of just asset class dynamics.
Marginal Portfolio Contribution / Competition for Capital: Evaluating investments based on their impact on total portfolio risk (“there are no buckets”) vs. how they fit within their own asset class portfolio and perform relative to asset class benchmarks.
Dynamic Reallocation: Having the ability to dynamically shift investments to areas with the best risk-adjusted returns, not marginal asset class shifts each year.
Framework Comparison of TPA to SAA – A Spectrum of Implementation Approaches
Source: CAIA Association.
TIFF’s Perspective: Useful Reminder of Best Practices, Not Revolutionary
TIFF’s view is that total portfolio thinking is fundamentally sound, but not new. Managing risk and capital at the portfolio level is simply good investment practice. In fact, experienced, top-tier investment teams have long considered cross-asset interactions, liquidity constraints, and marginal risk contributions when building portfolios, even if they did not label the process “TPA.”
TPA is a good reminder of portfolio construction best practices, regardless of title. When examining the real-world practices and implementation of TPA, TIFF found the best elements of TPA are already incorporated into our approach.
Limitations of TPA
In theory, TPA aims to be more dynamic and risk-aware than traditional SAA, but in practice it relies on a number of assumptions that don’t always hold up in real-world investing. These include: stable factor relationships, the ability to anticipate changes in volatility (timing the market), and the idea that illiquid positions can be managed with the same flexibility as liquid ones. Most large asset owners eventually find that the approach pushes decision-making away from true investment judgment and toward highly modeled, factor-driven processes that can look precise but are fragile in the face of regime shifts.
We also worry that approaches built around volatility-targeting or factor-optimization can inadvertently constrain returns or lead to many small “wins” followed by occasional large drawdowns, a pattern we’ve seen before in model-heavy frameworks.
Conclusion
The hype over the Total Portfolio Approach offers an important reminder: portfolios should be managed as integrated wholes, not as disconnected parts. TIFF agrees with this principle and practices it in substance. However, we remain skeptical of claims that TPA represents a fundamentally new or superior model that, on its own, delivers better performance.
In our view, TPA is best understood as common sense applied consistently, supported by strong governance, clear objectives, and experienced judgment. When used thoughtfully and pragmatically, total portfolio thinking can enhance decision-making. When treated as a cure-all or a rebranding exercise, it risks overselling what ultimately remains the same timeless challenge—building resilient portfolios that can meet long-term objectives across a wide range of market environments.
Past performance is no guarantee of future results and the opinions presented cannot be viewed as an indicator of future performance. There is no guarantee that any particular asset allocation or mix of strategies will meet your investment objectives.
The materials are being provided for informational purposes only and constitute neither an offer to sell nor a solicitation of an offer to buy securities. These materials also do not constitute investment, legal or tax advice. Opinions expressed herein are those of TIFF and are not a recommendation to buy or sell any securities.
These materials may contain forward-looking statements relating to future events. In some cases, you can identify forward-looking statements by terminology such as “may,” “will,” “should,” “expect,” “plan,” “intend,” “anticipate,” “believe,” “estimate,” “predict,” “potential,” or “continue,” the negative of such terms or other comparable terminology. Although TIFF believes the expectations reflected in the forward-looking statements are reasonable, future results cannot be guaranteed.
Artificial Intelligence is transforming how nonprofits operate, communicate, and deliver services.
According to The State of AI in Nonprofits 2025 report by Tech Soup and Tapp Network, “85% of nonprofits have a high interest in tools like Generative AI and Predictive Analysis.” Adoption, however, is uneven. While many leaders see its potential, many organizations lack the staffing, funding, or policies necessary for thoughtful AI adoption.
Consider these realities, from The State of AI in Nonprofits 2025 report:
76% of nonprofits do not have an AI strategy
42% of nonprofits have one to two staff learning to use AI
43% of nonprofits rely on one staff member to make IT and AI decisions
80% of organizations do not have an AI-acceptable use policy
If this sounds familiar, you are not alone.
Join us on Wednesday, November 19 from 12:00 – 12:40 PM EST for the webinar, How to Adopt AI in Your Nonprofit with Real-World Lessons. Anne Duggan, Managing Director, Client CIO Group at TIFF will be joined by Ebonie Johnson Cooper, Faculty Director, Nonprofit Executive Education & Training, The Do Good Institute at the University of Maryland, Remy Reya, Director of AI & Thought Leadership of Compass Pro Bono, and Beverly Ross, Program Director, Compass Pro Bono. Drawing on the real experience of Compass Pro Bono’s own AI journey, you will learn what worked, what didn’t, and key insights to apply to your organization. With an emphasis on change management, this webinar will appeal to early adopters and skeptics alike.
This session will help you:
Identify where AI can have the greatest impact in your operations
Ask the right strategic questions to guide your team
Build a roadmap that empowers your staff
Register today to take a proactive and responsible approach to integrating AI into your organization.
The materials are being provided for informational purposes only and constitute neither an offer to sell nor a solicitation of an offer to buy securities. These materials also do not constitute an offer or advertisement of TIFF’s investment advisory services or investment, legal or tax advice. Opinions expressed herein are those of TIFF and are not a recommendation to buy or sell any securities.
These materials may contain forward-looking statements relating to future events. In some cases, you can identify forward-looking statements by terminology such as “may,” “will,” “should,” “expect,” “plan,” “intend,” “anticipate,” “believe,” “estimate,” “predict,” “potential,” or “continue,” the negative of such terms or other comparable terminology. Although TIFF believes the expectations reflected in the forward-looking statements are reasonable, future results cannot be guaranteed.
You are now leaving TIFF Investment Management’s website and are going to a website that is not operated by TIFF Investment Management. We are not responsible for the content or availability of linked sites, and our inclusion of links to third-party websites does not imply any endorsement, approval, verification or monitoring by us of any of such linked sites’ content.