Market Observations
Market Summary
- Q3 2026 was a quarter with significant cross currents in capital markets. The MSCI ACWI Index was up 1.6% overall with technology being by far the largest contributor (6% return). In fact, all of the ACWI return can be explained by just Microsoft (+38%) and NVIDIA (+16%).
- Energy also had an excellent quarter with the sector up over 15%. Renewed conflict in the Persian Gulf contributed to a 30% increase in the price of oil in the quarter.
- Outside of tech and energy, the rest of the market as a group produced a slightly negative return. Healthcare and financials did well but many interest rate sensitive equity areas like small cap, real estate and utilities produced negative returns.
- For hedge funds, preliminary data from HFRI for the Fund of Funds Composite shows an estimated 1.7% loss the quarter.
- The most notable macro development was in the bond market. The ten-year U.S. Treasury yield increased by over 80 basis points to close at 5.29%, the highest level in roughly 20 years.
- Inflation continues to exceed the Fed’s long-term targets, resulting in an increase to the Fed Funds target rate of 25 bps, the first hike in three years.
Rising Treasury Yields – Risks and Opportunities
The yield to maturity on the 10-year U.S. Treasury bond is arguably the most important reference rate in global capital markets. We believe there are a variety of factors that have put pressure on U.S. Treasury bonds this year. The charts below highlight some of these issues.
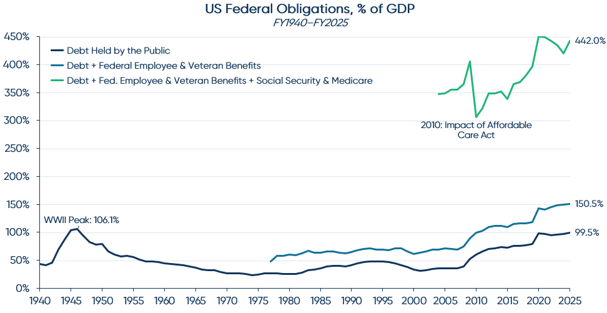
1. Debt to GDP
Total U.S. government debt outstanding is now roughly 100% of GDP, an all-time high except for a brief period at the end of World War II. However, the explicit debt outstanding likely understates the magnitude of the actual liability. If we include a basic estimate of additional liabilities including employee and veteran benefits, Social Security and Medicare the overall ratio of government liabilities to GDP is 442%.
2. Net Interest Expense as a Percentage of GDP
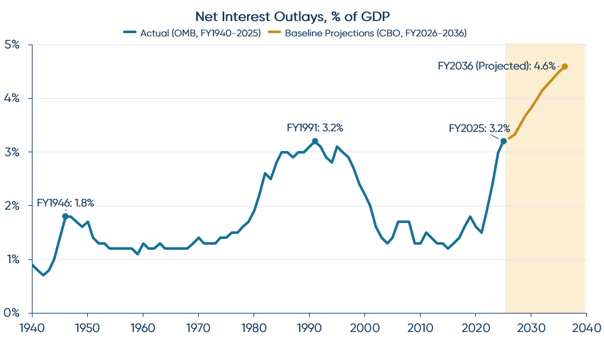
Total government interest expense as a percentage of GDP is now over 3%, close to the all-time high level from 1991. In addition, the Congressional Budget Office projects that this figure will increase to above 4% over the next decade due to a combination of refinancing maturing debt at higher interest rates, future deficit spending and growing entitlement programs. The reason that the interest expense as a percentage of GDP is so much higher than in the 1940s is because the weighted average rate on the debt outstanding is materially higher (less than 2% in 1945 compared to 3.4% and climbing today).
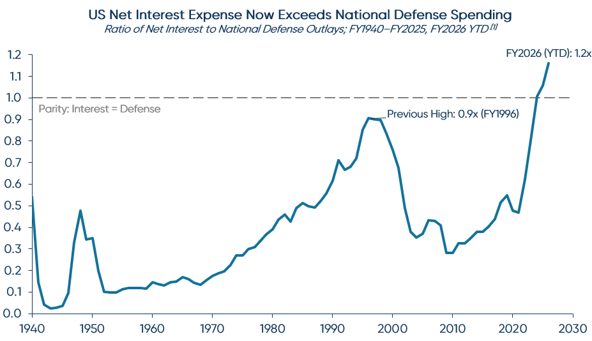
3. Net Interest Expense / Defense Spending
High interest expenses can crowd out more productive uses of capital including national security, economic growth, public health and other strategically important initiatives. For the first time in U.S. history, the country is now spending more on interest expense than on the military.
Some readers may argue that many of the above metrics have been challenging for years. Why the move in rates now? That is a difficult question to answer. Technology stocks were at very high valuations for years before the spring of 2000. Major Wall Street investment banks had highly levered balance sheets for years prior to fall of 2008. Identifying the spark that ignites a change in sentiment regarding longstanding risks is hard to do. The U.S. government has gotten away with an unsustainable fiscal imbalance for a long time. Something that can’t go on forever eventually doesn’t. Whether this recent uptick in rates is just noise or the start of a longer-term trend remains to be seen.
In the interest of providing a balanced assessment, there are other reasons why Treasurys have likely been under pressure. Large debt issuance by technology companies to fund the buildout of data centers and other AI infrastructure is also having an impact on rates, particularly in the 5-to-10-year maturity band of the curve. For context, through the last twelve months ending June 30, 2026, just four companies – Alphabet, Amazon, Meta and Oracle – issued close to $300 billion in bonds1. These are businesses that for many years issued very little debt. Between 2020 and 2022, the last years of the pre-AI era, total non-financial U.S. corporate bond issuance averaged less than $1 trillion. While a function of a large move in a short time, current yields are not high relative to long-term history. The best path forward for the U.S. is some combination of continued strong GDP growth and more fiscal discipline, both of which are still possible, but the degrees of freedom and flexibility on timing are starting to tighten.
For our portfolios, the fiscal pressures warrant caution, but higher yields also improve the prospective return from holding Treasurys. Based on an evaluation of the various observations above, we made an adjustment to the bond portfolios outlined in detail in the next section.
Performance, Positioning and Research Priorities
Performance
We expect the liquid portions of our portfolios to exceed the 65/35 benchmark for Q3 by over 1%. Exact totals will vary by client portfolio. In Public Equities, we expect to end up slightly ahead of ACWI. Another strong quarter by our systematic managers was offset by mixed results from some of our fundamental concentrated managers. Diversifiers (mostly hedge funds) had a very good quarter relative to benchmark. The preliminary results for our portfolios are an absolute return of over 1% (with a few accounts coming in lower), over 3% ahead of the HFRI Fund of Funds benchmark. Given the unusually strong performance from funds of hedge funds in the first half of the year, we think there was some reaching for extra return in the asset class. We have not done that, instead choosing to target a consistent risk posture with an expected beta to equities of approximately 0.30, low volatility and a broadly diversified portfolio across complementary sub-strategies. Areas of strong results in Q3 for our Diversifiers portfolio included systematic strategies, merger arbitrage and event-driven equities. Our Fixed Income portfolios generated absolute losses but also generally outperformed their benchmark due to our lower duration in a rising rate environment. We entered the quarter with a weighted average duration of 4.25 years compared to 5.95 years for the Bloomberg Aggregate Index. At this point we have received the private equity marks for Q2. Our private equity portfolios generated a gain of over 4%, a decent absolute result but well behind the MSCI ACWI return of 15% for the comparable quarter. While private investments have underperformed public equities over the past few years, we continue to believe in the long-term prospects for the asset class. Particularly in the two strategies that we manage in-house as opposed to with outside managers – direct transactions with independent sponsors and secondaries – we are continuing to source attractive opportunities.
Positioning
We continue to be close to benchmark across geography and sector exposures within Public Equities. During the quarter, we completed a review of AI-related exposure, which spans multiple industries and may not be fully captured by traditional risk models. Using AI-assisted analysis of public company information, followed by investment team review and comparison with external research, we identified businesses with meaningful AI sensitivity. Overall, we were underweight AI-related businesses broadly, consistent with our underweight semiconductor exposure that detracted from Q2 performance. We used July’s market weakness to selectively increase AI-related exposure through adjustments to passive holdings. These changes shifted the composition of our expected tracking error toward idiosyncratic security selection and away from general factor risk.
In addition, we made an adjustment to our bond portfolios at the end of September. Our bond benchmark is the Bloomberg Aggregate Index. However, our preference is to run conservatively in this area and assume corporate cash flow risk elsewhere in the portfolio, particularly in equities, where we think we will be better compensated over time (i.e., unlimited upside, unlike with investment grade bonds). That is why our portfolios have been almost 100% U.S. Treasury bonds and bills for most of the past decade. In addition, we have had lower duration than the benchmark for years, particularly during the COVID period when we gauged that bonds offered zero real return and diminished diversification value. We have increased duration over the past few years, but have remained underweight the benchmark for a variety of reasons including those noted above. Having lower duration has served us well over 2026 as rates have risen. However, by the end of the quarter Treasury yields had reached 20-year highs and long-term inflation expectations, at least as measured by TIPS breakevens, have remained modest at roughly 2.0.-2.5%, depending on forecast horizon. While there is always a risk that actual inflation will be higher than expected inflation, an implied real return between 2.5% and 3.0% represents some of the best value we have seen in Treasurys in decades. We increased our duration to 5.0 years over last few trading days in September. Similar to the AI adjustment in equities, we are still assuming less duration risk than the benchmark, but it made sense to reduce the size of the bet given the price moves in Q3.
We concluded several manager research initiatives this quarter, adding managers to portfolios where appropriate. In Public Equities, additions included Japanese activist strategies focused on improving corporate capital allocation, a multi-manager platform combining fundamental research with systematic risk management, and two emerging fundamental managers. We funded these investments with redemptions from several other active manager positions. We secured favorable fee terms for clients on several of the additions. Within Diversifiers, we gained access to a capacity-constrained systematic manager we have followed for years. We suspect that the limited distributions from private equity portfolios over the past few years is continuing to cause other investors to be forced to make redemptions from their more liquid positions, creating opportunities for us. Together, these additions reflect our ongoing work to continuously improve the portfolios.
Research Priorities
We have multiple promising manager ideas in process, but they do not fall neatly into a single theme and many are earlier stage than some of the ideas we outlined last quarter. We are in various stages of diligence on a multi-manager platform we have followed for years where a change to their terms has made the investment more attractive to us, several public equity managers in Europe and some systematic and arbitrage managers in Asia, a market that continues to have an attractive combination of good liquidity, high volatility and wide dispersion of returns across stocks – a generally supportive set of conditions for active management.
General Updates
In September, TIFF’s Private Markets team hosted its second annual Capital Connections event, bringing together roughly 100 independent sponsors, institutional investors and our board. The program opened with a closed-door information session for sponsors regarding LP priorities when evaluating a first-time fund, followed by a reception and dinner. The event has already generated follow-up deal flow, strengthening TIFF’s relationships across the independent sponsor community. Events like this are critical to our sourcing of leading independent sponsors and deepening our connection to the private equity ecosystem.
We look forward to seeing many of you in Boston on October 28th and 29th at the 2026 TIFF Investment Forum. Thank you for your ongoing partnership and best wishes for a great close to 2026.
Past performance is no guarantee of future results and the opinions presented cannot be viewed as an indicator of future performance. There is no guarantee that any particular asset allocation or mix of strategies will meet your investment objectives.
These materials are being provided for informational purposes only and constitute neither an offer to sell nor a solicitation of an offer to buy securities. These materials also do not constitute an offer or advertisement of TIFF’s investment advisory services or investment, legal or tax advice. Opinions expressed herein are those of TIFF and are not a recommendation to buy or sell any securities.
These materials may contain forward-looking statements relating to future events. In some cases, you can identify forward-looking statements by terminology such as “may,” “will,” “should,” “expect,” “plan,” “intend,” “anticipate,” “believe,” “estimate,” “predict,” “potential,” or “continue,” the negative of such terms or other comparable terminology. Although TIFF believes the expectations reflected in the forward-looking statements are reasonable, future results cannot be guaranteed.
HFRI Fund of Funds Composite Index is an equal weighted index reporting returns (net of all fees) of participating hedge funds of funds. A fund of funds may allocate its assets to numerous managers within a single strategy, or to numerous managers in multiple strategies. HFRI indices are being used under license from Hedge Fund Research, Inc., which does not approve of or endorse the contents of this report.
Footnotes
Includes a $27.3 billion bond issued in October 2025 by Beignet Investor LLC, a Blue Owl Capital-controlled vehicle financing Meta’s Hyperion data center in Louisiana.